Planning for Sport and Active Recreation Facilities ... - Brent Council
Planning for Sport and Active Recreation Facilities ... - Brent Council
Planning for Sport and Active Recreation Facilities ... - Brent Council

You also want an ePaper? Increase the reach of your titles
YUMPU automatically turns print PDFs into web optimized ePapers that Google loves.
Chapter Six Indoor <strong>Sport</strong>s Facility Provision<br />
Capacity Ratios<br />
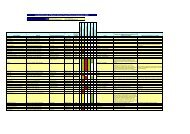
Table 15 sets out the current supply of sports hall space<br />
across the borough, firstly including all facilities <strong>and</strong><br />
secondly just publicly accessible facilities (i.e. those<br />
facilities that are accessible to the public on a pay <strong>and</strong><br />
play basis <strong>and</strong>/or to clubs / groups)<br />
Table 15: Capacity ratio’s – sports halls<br />
Facility<br />
Type<br />
All <strong>Sport</strong>s<br />
Halls<br />
Publicly<br />
Accessible<br />
Current<br />
Provision<br />
As can be seen, this distinction between accessibility has<br />
a significant impact upon the borough-wide capacity<br />
ratio. For all facilities the current capacity ratio is 68.23<br />
m2 of sports hall per 1000 population. This is higher than<br />
the current London average of 59.77 m2, but lower than<br />
the Engl<strong>and</strong> Average of 74.54m². This calculation shows<br />
that the existing level of sports hall provision across <strong>Brent</strong><br />
is marginally in excess of the London average. However,<br />
this presumes that the London average is adequate,<br />
which may not be the case. Compared to the national<br />
average <strong>Brent</strong> would require an extra 1,661 m2 of sport<br />
hall space in 2001 <strong>and</strong> 4785 m2 of sport hall space by<br />
2016 to meet the national average. When the private<br />
use facilities are removed from the equation, the capacity<br />
ratio drops significantly. However, it is not possible to<br />
provide London or Engl<strong>and</strong> average data <strong>for</strong> publicly<br />
accessible facilities only <strong>and</strong> there<strong>for</strong>e there can be no<br />
comparisons upon which to make an assessment of capacity.<br />
Although the capacity ratio calculations above are<br />
useful in assessing capacity against London <strong>and</strong> national<br />
averages, it is vital that dem<strong>and</strong> is assessed at a local level<br />
<strong>and</strong> hence the calculations above should be used only<br />
as an indication <strong>and</strong> The <strong>Facilities</strong> <strong>Planning</strong> Model results<br />
which will be analysed shortly should take precedence.<br />
It is possible to use the Capacity ratios tool to look at<br />
square metreage provision per 1000 population at a<br />
ward level. However, as most facilities are not located<br />
within the centre of a ward, <strong>and</strong> generally people don’t<br />
recognise ward boundaries, this in<strong>for</strong>mation is of limited<br />
use other than to highlight significant deficiencies or<br />
areas of high provision. Analysing all sports hall facility<br />
provision at a ward level shows that Mapesbury, Dudden<br />
Hill <strong>and</strong> Harlesden wards have a capacity ratio of ‘0’ as<br />
there are no sports halls <strong>and</strong> that the highest capacity<br />
ratios (greatest square metreage per 1000 population) are<br />
in the wards of Barnhill, Wembley Central <strong>and</strong> Willesden<br />
Green.<br />
CAPACITY RATIO ( Facility type per 1000 population) - DEFICIENCY / + SURPLUS<br />
(In comparison with<br />
London average)<br />
TOTAL<br />
(m²)<br />
2001<br />
(263507)<br />
2001<br />
(293900)<br />
2016<br />
(305400)<br />
London<br />
average<br />
(2001)<br />
Engl<strong>and</strong><br />
average<br />
(2001)<br />
Current<br />
(2001)<br />
(m²)<br />
Mid<br />
(2011)<br />
(m²)<br />
Quality<br />
The majority of the Borough’s sports halls are over<br />
30 years old <strong>and</strong>, as a consequence, they tend to<br />
be less efficient to operate, have increased levels of<br />
maintenance, <strong>and</strong> customer satisfaction is lower as public<br />
expectations increase. This can result in fewer bookings<br />
<strong>and</strong> there<strong>for</strong>e fewer people utilising the facilities the<br />
borough has on offer.<br />
Accessibility<br />
<strong>Active</strong> Places power website enables a detailed map (map<br />
31) to be drawn that shows actual walking travel time<br />
to a <strong>Sport</strong> Hall (all sports halls), taking into consideration<br />
facilities that may be located in neighbouring Boroughs.<br />
The areas in red represent the parts of the Borough<br />
where residents have the greatest distance to walk to<br />
reach a sports centre. The areas in blue show the areas<br />
where people have the shortest travel time to a sports<br />
hall. It shows that the Dollis Hill, Mapesbury <strong>and</strong> Dudden<br />
Hill wards are outside a 20 minute walk time of a publicly<br />
accessible sports hall.<br />
Chapter Six - Indoor <strong>Sport</strong>s Facility Provision<br />
Future<br />
(2016)<br />
(m²)<br />
28 17,980 68.23 61.18 58.87 59.77 74.54 +2230 +414 -274<br />
19 12,466 47.31 42.42 40.82 N/A N/A N/A N/A N/A<br />
56


![0702012-khat[1] - Brent Council](https://img.yumpu.com/11457346/1/184x260/0702012-khat1-brent-council.jpg?quality=85)