Organizational Change for Participatory Irrigation Management
Organizational Change for Participatory Irrigation Management
Organizational Change for Participatory Irrigation Management

Create successful ePaper yourself
Turn your PDF publications into a flip-book with our unique Google optimized e-Paper software.
ones feeding 5,000 ha (Venkataswamy, 1994). Recently the area under tanks command has<br />
fallen by 22 percent due to multifarious factors like improper maintenance, siltation,<br />
encroachment etc.<br />
Open wells have been in use since time immemorial. They are more common in the red<br />
soils of southern India. Their yields are about 70,000-2,30,000 lit/day. The number of dug<br />
wells, shallow tube-wells and public tube-wells was 14.3 million in 1990. In 1983-84, the area<br />
irrigated was 51.5 million ha, of which the area accounted <strong>for</strong> by canals was 38.3 percent; by<br />
wells, 39.3 percent; by tanks, 6.2 percent; and by other sources, 16.2 percent. In the Punjab<br />
State, there has been a substantial increase in the area under irrigation due to increase in<br />
number of tube-wells. More than 60 percent of the total 93 percent of the irrigated area is<br />
covered by tube-well irrigation (Pasricha, 1998).<br />
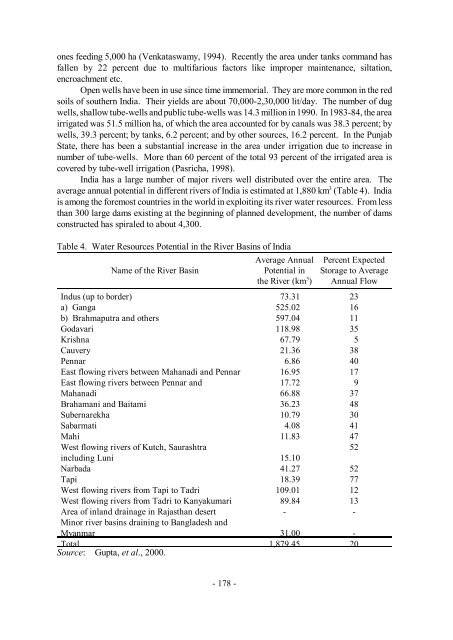
India has a large number of major rivers well distributed over the entire area. The<br />
average annual potential in different rivers of India is estimated at 1,880 km 3 (Table 4). India<br />
is among the <strong>for</strong>emost countries in the world in exploiting its river water resources. From less<br />
than 300 large dams existing at the beginning of planned development, the number of dams<br />
constructed has spiraled to about 4,300.<br />
Table 4. Water Resources Potential in the River Basins of India<br />
Name of the River Basin<br />
- 178 -<br />
Average Annual<br />
Potential in<br />
the River (km 3 )<br />
Percent Expected<br />
Storage to Average<br />
Annual Flow<br />
Indus (up to border) 73.31 23<br />
a) Ganga 525.02 16<br />
b) Brahmaputra and others 597.04 11<br />
Godavari 118.98 35<br />
Krishna 67.79 5<br />
Cauvery 21.36 38<br />
Pennar 6.86 40<br />
East flowing rivers between Mahanadi and Pennar 16.95 17<br />
East flowing rivers between Pennar and 17.72 9<br />
Mahanadi 66.88 37<br />
Brahamani and Baitami 36.23 48<br />
Subernarekha 10.79 30<br />
Sabarmati 4.08 41<br />
Mahi 11.83 47<br />
West flowing rivers of Kutch, Saurashtra 52<br />
including Luni 15.10<br />
Narbada 41.27 52<br />
Tapi 18.39 77<br />
West flowing rivers from Tapi to Tadri 109.01 12<br />
West flowing rivers from Tadri to Kanyakumari 89.84 13<br />
Area of inland drainage in Rajasthan desert - -<br />
Minor river basins draining to Bangladesh and<br />
Myanmar 31.00 -<br />
Total 1,879.45 20<br />
Source: Gupta, et al., 2000.