Organizational Change for Participatory Irrigation Management
Organizational Change for Participatory Irrigation Management
Organizational Change for Participatory Irrigation Management

Create successful ePaper yourself
Turn your PDF publications into a flip-book with our unique Google optimized e-Paper software.
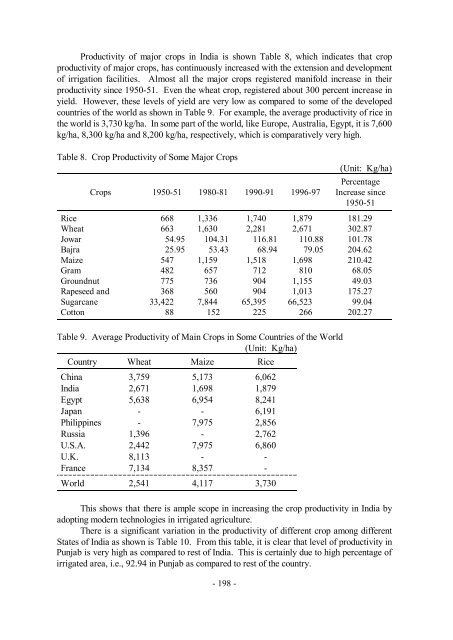
Productivity of major crops in India is shown Table 8, which indicates that crop<br />
productivity of major crops, has continuously increased with the extension and development<br />
of irrigation facilities. Almost all the major crops registered manifold increase in their<br />
productivity since 1950-51. Even the wheat crop, registered about 300 percent increase in<br />
yield. However, these levels of yield are very low as compared to some of the developed<br />
countries of the world as shown in Table 9. For example, the average productivity of rice in<br />
the world is 3,730 kg/ha. In some part of the world, like Europe, Australia, Egypt, it is 7,600<br />
kg/ha, 8,300 kg/ha and 8,200 kg/ha, respectively, which is comparatively very high.<br />
Table 8. Crop Productivity of Some Major Crops<br />
Crops 1950-51 1980-81 1990-91 1996-97<br />
- 198 -<br />
(Unit: Kg/ha)<br />
Percentage<br />
Increase since<br />
1950-51<br />
Rice 668 1,336 1,740 1,879 181.29<br />
Wheat 663 1,630 2,281 2,671 302.87<br />
Jowar 54.95 104.31 116.81 110.88 101.78<br />
Bajra 25.95 53.43 68.94 79.05 204.62<br />
Maize 547 1,159 1,518 1,698 210.42<br />
Gram 482 657 712 810 68.05<br />
Groundnut 775 736 904 1,155 49.03<br />
Rapeseed and 368 560 904 1,013 175.27<br />
Sugarcane 33,422 7,844 65,395 66,523 99.04<br />
Cotton 88 152 225 266 202.27<br />
Table 9. Average Productivity of Main Crops in Some Countries of the World<br />
(Unit: Kg/ha)<br />
Country Wheat Maize Rice<br />
China 3,759 5,173 6,062<br />
India 2,671 1,698 1,879<br />
Egypt 5,638 6,954 8,241<br />
Japan - - 6,191<br />
Philippines - 7,975 2,856<br />
Russia 1,396 - 2,762<br />
U.S.A. 2,442 7,975 6,860<br />
U.K. 8,113 - -<br />
France 7,134 8,357 -<br />
World 2,541 4,117 3,730<br />
This shows that there is ample scope in increasing the crop productivity in India by<br />
adopting modern technologies in irrigated agriculture.<br />
There is a significant variation in the productivity of different crop among different<br />
States of India as shown is Table 10. From this table, it is clear that level of productivity in<br />
Punjab is very high as compared to rest of India. This is certainly due to high percentage of<br />
irrigated area, i.e., 92.94 in Punjab as compared to rest of the country.