Organizational Change for Participatory Irrigation Management
Organizational Change for Participatory Irrigation Management
Organizational Change for Participatory Irrigation Management

Create successful ePaper yourself
Turn your PDF publications into a flip-book with our unique Google optimized e-Paper software.
Surface and groundwater potential is maximum in Ganga basin followed by Brahmaputra.<br />
While resource potential of Brahmaputra is difficult to tap due to geographical conditions,<br />
Ganga basin has good potential <strong>for</strong> expansion and that is why Uttar Pradesh has maximum<br />
irrigated area in the country. Up to now, India has tapped easily exploitable irrigation<br />
potential, and further expansion is difficult. For example, inter-basin transfers etc. may be<br />
necessary, which will require huge financial resources and ef<strong>for</strong>ts.<br />
Another important aspect is that total assessed irrigation potential of India is only 139.89<br />
million ha while cultivated area is 142.215 million ha at present. It indicates that whole of the<br />
cultivated area cannot be irrigated according to present assessment. However, the gross<br />
irrigated area is only 71.510 million ha, which is about 51 percent of the ultimate irrigation<br />
potential leaving about 68.38 million ha. <strong>for</strong> further expansion of irrigation facilities.<br />
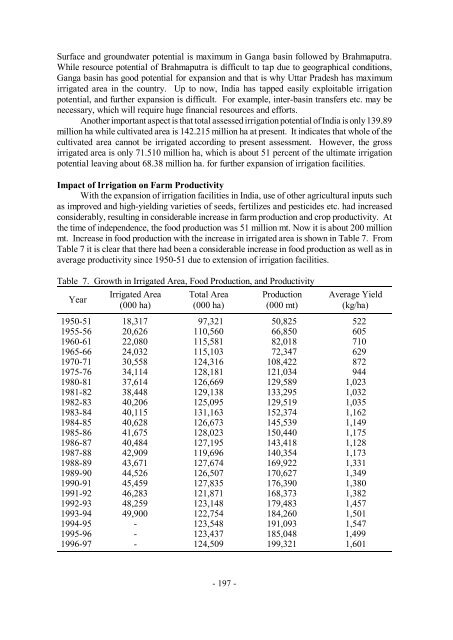
Impact of <strong>Irrigation</strong> on Farm Productivity<br />
With the expansion of irrigation facilities in India, use of other agricultural inputs such<br />
as improved and high-yielding varieties of seeds, fertilizes and pesticides etc. had increased<br />
considerably, resulting in considerable increase in farm production and crop productivity. At<br />
the time of independence, the food production was 51 million mt. Now it is about 200 million<br />
mt. Increase in food production with the increase in irrigated area is shown in Table 7. From<br />
Table 7 it is clear that there had been a considerable increase in food production as well as in<br />
average productivity since 1950-51 due to extension of irrigation facilities.<br />
Table 7. Growth in Irrigated Area, Food Production, and Productivity<br />
Year<br />
Irrigated Area<br />
(000 ha)<br />
Total Area<br />
(000 ha)<br />
- 197 -<br />
Production<br />
(000 mt)<br />
Average Yield<br />
(kg/ha)<br />
1950-51 18,317 97,321 50,825 522<br />
1955-56 20,626 110,560 66,850 605<br />
1960-61 22,080 115,581 82,018 710<br />
1965-66 24,032 115,103 72,347 629<br />
1970-71 30,558 124,316 108,422 872<br />
1975-76 34,114 128,181 121,034 944<br />
1980-81 37,614 126,669 129,589 1,023<br />
1981-82 38,448 129,138 133,295 1,032<br />
1982-83 40,206 125,095 129,519 1,035<br />
1983-84 40,115 131,163 152,374 1,162<br />
1984-85 40,628 126,673 145,539 1,149<br />
1985-86 41,675 128,023 150,440 1,175<br />
1986-87 40,484 127,195 143,418 1,128<br />
1987-88 42,909 119,696 140,354 1,173<br />
1988-89 43,671 127,674 169,922 1,331<br />
1989-90 44,526 126,507 170,627 1,349<br />
1990-91 45,459 127,835 176,390 1,380<br />
1991-92 46,283 121,871 168,373 1,382<br />
1992-93 48,259 123,148 179,483 1,457<br />
1993-94 49,900 122,754 184,260 1,501<br />
1994-95 - 123,548 191,093 1,547<br />
1995-96 - 123,437 185,048 1,499<br />
1996-97 - 124,509 199,321 1,601