- Page 1 and 2:
TotalView Users Guide version 8.7
- Page 3 and 4:
Book Overview part I - Introduction
- Page 5 and 6:
Contents About This Book TotalView
- Page 7 and 8:
Setting Preferences, Options, and X
- Page 9 and 10:
Installation Notes ................
- Page 11 and 12:
Starting Processes and Threads ....
- Page 13 and 14:
Displaying Allocated Arrays........
- Page 15 and 16:
Using Built-In Statements .........
- Page 17 and 18:
Figures Chapter 1: Getting Started
- Page 19 and 20:
Figure 76. File > Preferences: Bulk
- Page 21 and 22:
Chapter 13: Using Groups, Processes
- Page 23 and 24:
About This Book This book describes
- Page 25 and 26:
How to Use This Book The informatio
- Page 27 and 28:
Conventions and what you should cli
- Page 29 and 30:
Contacting Us Contacting Us Please
- Page 31:
Part I: Introduction This part of t
- Page 34 and 35:
Getting Started Figure 1: The Proce
- Page 36 and 37:
Getting Started Figure 3: Setting C
- Page 38 and 39:
Getting Started Figure 5: Diving on
- Page 40 and 41:
Debugging Multi-process and Multi-t
- Page 42 and 43:
Using Groups and Barriers Figure 10
- Page 44 and 45:
Introducing the CLI Introducing the
- Page 46 and 47:
A Couple of Processes Figure 14: A
- Page 48 and 49:
Threads Figure 18: Threads Threads
- Page 50 and 51:
Types of Threads Figure 20: Four Pr
- Page 52 and 53:
Organizing Chaos Figure 23: User, S
- Page 54 and 55:
Organizing Chaos Figure 25: Five Pr
- Page 56 and 57:
Creating Groups Figure 27: Step 1:
- Page 58 and 59:
Creating Groups Figure 30: Step 5:
- Page 60 and 61:
Simplifying What You’re Debugging
- Page 62 and 63:
Simplifying What You’re Debugging
- Page 65 and 66:
c h a p t e r Getting Started with
- Page 67 and 68:
Figure 36: Remote Display Client Se
- Page 69 and 70:
Figure 38: Asking for Password Usin
- Page 71 and 72:
Using Remote Display You can, of co
- Page 73 and 74:
Figure 42: Local Data in a Stack Fr
- Page 75 and 76:
Figure 43: Access By Options Remote
- Page 77 and 78:
Figure 44: Remote Host Information
- Page 79 and 80:
Figure 47: Saving a Profile Figure
- Page 81 and 82:
c h a p t e r Setting Up a Debuggin
- Page 83 and 84:
Starting TotalView customer_compili
- Page 85 and 86:
Starting TotalView If you type an e
- Page 87 and 88:
Starting TotalView Before Version 6
- Page 89 and 90:
Figure 53: Start a New Process Load
- Page 91 and 92:
Figure 55: Open a Core File Start a
- Page 93 and 94:
Figure 57: Thread > Continuation Si
- Page 95 and 96:
Figure 59: Setting Command-Line Opt
- Page 97 and 98:
Figure 61: Root Window Showing Proc
- Page 99 and 100:
Handling Signals Thread > Continuat
- Page 101 and 102:
Setting Search Paths Make your chan
- Page 103 and 104:
Figure 65: Select Directory Dialog
- Page 105 and 106:
Figure 66: File > Preferences Dialo
- Page 107 and 108:
Setting Preferences Dynamic Librari
- Page 109 and 110:
Setting Preferences Pointer Dive Th
- Page 111 and 112:
Setting Preferences Similarly, docu
- Page 113 and 114:
c h a p t e r 5 Setting Up Remote D
- Page 115 and 116:
Figure 75: File > Preferences: Laun
- Page 117 and 118:
Figure 76: File > Preferences: Bulk
- Page 119 and 120:
Figure 77: Manual Launching of Debu
- Page 121 and 122:
Starting the TotalView Server Manua
- Page 123 and 124:
Disabling Autolaunch Setting Bulk S
- Page 125 and 126:
Figure 78: Launching tvdsvr Disabli
- Page 127 and 128:
Figure 80: Debugging Session Over a
- Page 129 and 130:
c h a p t e r 6 Setting Up MPI Debu
- Page 131 and 132:
Figure 82: File > New Program Dialo
- Page 133 and 134:
Debugging MPICH Applications The MP
- Page 135 and 136:
Debugging MPICH Applications 4 Afte
- Page 137 and 138:
Starting MPI Issues Starting TotalV
- Page 139 and 140:
Figure 86: Tools > Message Queue Gr
- Page 141 and 142:
Displaying the Message Queue play i
- Page 143 and 144:
Figure 90: Message Queue Window Sho
- Page 145 and 146:
Debugging HP MPI Applications This
- Page 147 and 148:
Debugging IBM MPI Parallel Environm
- Page 149 and 150:
Debugging IBM MPI Parallel Environm
- Page 151 and 152:
Debugging LAM/MPI Applications the
- Page 153 and 154:
Debugging SiCortex MPI Applications
- Page 155 and 156:
Debugging Sun MPI Applications mapp
- Page 157 and 158:
Figure 91: Group > Attach Subset Di
- Page 159 and 160:
Debugging Parallel Applications Tip
- Page 161 and 162:
Debugging Parallel Applications Tip
- Page 163 and 164:
c h a p t e r 7 Setting Up Parallel
- Page 165 and 166:
Debugging OpenMP Applications � T
- Page 167 and 168:
Figure 95: OpenMP Shared Variable T
- Page 169 and 170: Figure 96: OpenMP THREADPRIVATE Com
- Page 171 and 172: Figure 98: Cell Architecture PPE PP
- Page 173 and 174: Figure 100: Root Window for a Cell
- Page 175 and 176: Figure 103: Register Union Debuggin
- Page 177 and 178: Debugging Cray XT Applications For
- Page 179 and 180: Debugging SiCortex Applications Her
- Page 181 and 182: Debugging Global Arrays Application
- Page 183 and 184: Debugging PVM (Parallel Virtual Mac
- Page 185 and 186: Debugging PVM (Parallel Virtual Mac
- Page 187 and 188: Figure 106: PVM Tasks and Configura
- Page 189 and 190: Figure 107: SHMEM Sample Session
- Page 191 and 192: Figure 108: A Sliced UPC Array Figu
- Page 193 and 194: Figure 111: Pointer to a Shared Var
- Page 195 and 196: Part III: Using the GUI The two cha
- Page 197 and 198: c h a p t e r Using TotalView Windo
- Page 199 and 200: Figure 112: Root Window Figure 113:
- Page 201 and 202: Figure 115: Sorted and Aggregated R
- Page 203 and 204: Figure 117: Line Numbers with Stop
- Page 205 and 206: Figure 119: Assembly Only (Symbolic
- Page 207 and 208: Figure 122: Backward and Forward Bu
- Page 209 and 210: Figure 124: File > Save Pane Dialog
- Page 211 and 212: c h a p t e r 9 Visualizing Program
- Page 213 and 214: Command Summary Visualizing Array D
- Page 215 and 216: Figure 127: A Three- Dimensional Ar
- Page 217 and 218: Figure 129: Graph and Surface Visua
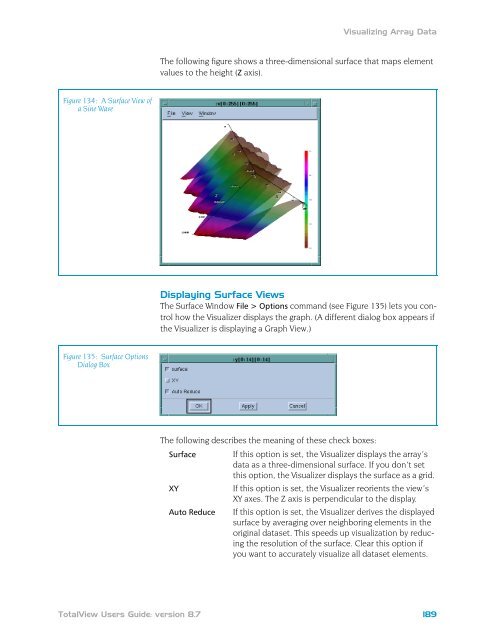
- Page 219: Figure 130: Visualizer Graph View W
- Page 223 and 224: Visualizing Array Data Manipulating
- Page 225 and 226: Visualizing Array Data quickly see
- Page 227 and 228: Visualizing Array Data different vi
- Page 229 and 230: Part IV: Using the CLI The chapters
- Page 231 and 232: c h a p t e r Using the CLI 10 The
- Page 233 and 234: Using the CLI Interface Starting th
- Page 235 and 236: # source make_actions.tcl # dload f
- Page 237 and 238: About CLI Output About CLI Output A
- Page 239 and 240: Using Namespaces Using Namespaces C
- Page 241 and 242: How Parallelism Affects Behavior Ho
- Page 243 and 244: Controlling Program Execution Typic
- Page 245 and 246: c h a p t e r 11 Seeing the CLI at
- Page 247 and 248: Initializing an Array Slice Initial
- Page 249 and 250: Writing an Array Variable to a File
- Page 251 and 252: } } Automatically Setting Breakpoin
- Page 253 and 254: Part V: Debugging The chapters in t
- Page 255 and 256: c h a p t e r Debugging Programs 12
- Page 257 and 258: Figure 141: View > Lookup Variable
- Page 259 and 260: Figure 146: View > Lookup Function
- Page 261 and 262: Manipulating Processes and Threads
- Page 263 and 264: Figure 150: The Threads Tab Updatin
- Page 265 and 266: Why breakpoints don’t work (part
- Page 267 and 268: Examining Groups Manipulating Proce
- Page 269 and 270: Manipulating Processes and Threads
- Page 271 and 272:
Figure 155: Stepping Illustrated Us
- Page 273 and 274:
Executing to a Selected Line If the
- Page 275 and 276:
Killing (Deleting) Programs 3 Conti
- Page 277 and 278:
Figure 158: Tools > Debugger Loaded
- Page 279 and 280:
Figure 160: File > Preferences: Dyn
- Page 281 and 282:
Setting the Program Counter some co
- Page 283 and 284:
c h a p t e r Using Groups, Process
- Page 285 and 286:
Stepping (Part I) � Set breakpoin
- Page 287 and 288:
Understanding Thread Width Stepping
- Page 289 and 290:
Understanding Process/Thread Sets S
- Page 291 and 292:
Specifying Arenas Setting Process a
- Page 293 and 294:
Figure 163: Width Specifiers Settin
- Page 295 and 296:
Setting Group Focus � Lockstep Gr
- Page 297 and 298:
Specifier Specifies Setting Group F
- Page 299 and 300:
‘All’ Does Not Always Mean ‘A
- Page 301 and 302:
The following are some additional e
- Page 303 and 304:
Setting Group Focus Although the lo
- Page 305 and 306:
Naming Lists with Inconsistent Widt
- Page 307 and 308:
Using P/T Set Operators Using P/T S
- Page 309 and 310:
Figure 164: Group > Custom Groups D
- Page 311 and 312:
c h a p t e r Examining and Changin
- Page 313 and 314:
Figure 167: List and Vector Transfo
- Page 315 and 316:
Figure 169: A Tooltip Displaying Va
- Page 317 and 318:
Displaying Variables since the vari
- Page 319 and 320:
Figure 173: Variable Window Showing
- Page 321 and 322:
Displaying Variables Scoping Issues
- Page 323 and 324:
Figure 177: Program Browser and Var
- Page 325 and 326:
Figure 179: Diving on Local Variabl
- Page 327 and 328:
Figure 181: View > Examine Format >
- Page 329 and 330:
Figure 184: Variable Window with Ma
- Page 331 and 332:
Figure 185: Undive/Redive Buttons F
- Page 333 and 334:
Figure 188: Displaying C Structures
- Page 335 and 336:
Figure 190: The Tools > Expression
- Page 337 and 338:
Figure 193: Expression List Window
- Page 339 and 340:
Figure 197: Using Functions in the
- Page 341 and 342:
Viewing a List of Variables (or sel
- Page 343 and 344:
Figure 199: Using an Expression to
- Page 345 and 346:
Figure 200: Three Casts Changing a
- Page 347 and 348:
Changing a Variable’s Data Type W
- Page 349 and 350:
Changing a Variable’s Data Type T
- Page 351 and 352:
Figure 202: Displaying wchar_t Data
- Page 353 and 354:
Changing the Address of Variables D
- Page 355 and 356:
Figure 204: Displaying C++ Classes
- Page 357 and 358:
Figure 205: Diving on a Common Bloc
- Page 359 and 360:
Figure 207: Fortran 90 User- Define
- Page 361 and 362:
Displaying Thread Objects that has
- Page 363 and 364:
Figure 210: Variable Window: Showin
- Page 365 and 366:
c h a p t e r Examining Arrays 15 T
- Page 367 and 368:
Examining and Analyzing Arrays This
- Page 369 and 370:
Figure 213: An Array Slice and an A
- Page 371 and 372:
Figure 214: Array Data Filtering by
- Page 373 and 374:
Figure 216: Array Data Filtering by
- Page 375 and 376:
Figure 218: Array Statistics Window
- Page 377 and 378:
Figure 219: Viewing Across Threads
- Page 379 and 380:
Visualizing Array Data Visualizing
- Page 381 and 382:
c h a p t e r 16 Setting Action Poi
- Page 383 and 384:
Figure 222: Action Point Tab Settin
- Page 385 and 386:
Figure 224: Setting Breakpoints on
- Page 387 and 388:
Figure 227: Ambiguous Function Dial
- Page 389 and 390:
Figure 229: Action Point > At Locat
- Page 391 and 392:
Figure 232: PC Arrow Over a Stop Ic
- Page 393 and 394:
Setting Breakpoints and Barriers at
- Page 395 and 396:
Setting Breakpoints and Barriers Ab
- Page 397 and 398:
Setting Breakpoints and Barriers Wh
- Page 399 and 400:
Defining Eval Points and Conditiona
- Page 401 and 402:
Defining Eval Points and Conditiona
- Page 403 and 404:
Figure 236: Stopped Execution of Co
- Page 405 and 406:
Using Watchpoints Platform Assemble
- Page 407 and 408:
Using Watchpoints Computer Constrai
- Page 409 and 410:
Watching Memory Using Watchpoints A
- Page 411 and 412:
The following is an expression that
- Page 413 and 414:
c h a p t e r Evaluating Expression
- Page 415 and 416:
Why is There an Expression System?
- Page 417 and 418:
Figure 240: Expression List Window:
- Page 419 and 420:
Using Programming Language Elements
- Page 421 and 422:
Using the Evaluate Window Using the
- Page 423 and 424:
Figure 244: Evaluating Information
- Page 425 and 426:
Using the Evaluate Window Pseudo Op
- Page 427 and 428:
Using Built-in Variables and Statem
- Page 429 and 430:
Glossary ACTION POINT: A debugger f
- Page 431 and 432:
off the function reference to an ev
- Page 433 and 434:
DOPE VECTOR: This is a run time des
- Page 435 and 436:
INITIALIZATION FILE: An optional fi
- Page 437 and 438:
PARCEL: The number of bytes require
- Page 439 and 440:
threads. There are two kinds of ser
- Page 441 and 442:
SYMBOL NAME: The name associated wi
- Page 443 and 444:
Index Symbols # scope separator cha
- Page 445 and 446:
array structure viewing limitations
- Page 447 and 448:
context 138 description 140 empty c
- Page 449 and 450:
Tools > Watchpoint 10, 378 totalvie
- Page 451 and 452:
into a stack frame 174 into a struc
- Page 453 and 454:
-file command-line option to Visual
- Page 455 and 456:
see alsoshared libraries limitation
- Page 457 and 458:
expressions 275 set of arenas 259 s
- Page 459 and 460:
PVM groups, unrelated to process gr
- Page 461 and 462:
stride elements 334 UPC 158 upper b
- Page 463 and 464:
threads model 18 threads tab 230 th
- Page 465 and 466:
View > Compilation Scope commands 2


