

New Statistical Algorithms for the Analysis of Mass - FU Berlin, FB MI ...
New Statistical Algorithms for the Analysis of Mass - FU Berlin, FB MI ...
New Statistical Algorithms for the Analysis of Mass - FU Berlin, FB MI ...

You also want an ePaper? Increase the reach of your titles
YUMPU automatically turns print PDFs into web optimized ePapers that Google loves.
100 CHAPTER 4. (BIO-)MEDICAL APPLICATIONS<br />
Training classifiers with fingerprint F1 we used 10-fold cross-validation to<br />
measure <strong>the</strong> per<strong>for</strong>mance <strong>of</strong> <strong>the</strong>se classifiers. The results are shown in Figure<br />
4.5.16.<br />
Training classifiers with fingerprint F2 we used 10-fold cross-validation to<br />
measure <strong>the</strong> per<strong>for</strong>mance <strong>of</strong> <strong>the</strong>se classifiers. The results are shown in Figure<br />
4.5.17.<br />
To show that <strong>the</strong> fingerprints are generalizable we <strong>the</strong>n used <strong>the</strong> fingerprints<br />
F1 and F2 to build classifiers that can distinguish between <strong>the</strong> TPO<br />
and Tg antibody classes. Per<strong>for</strong>mance was again measured by <strong>the</strong> 10-fold<br />
cross-validation schema. These results are shown in Figure 4.5.18.<br />
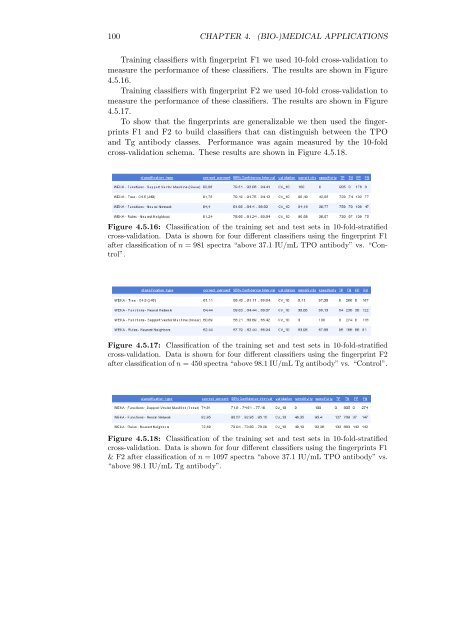
Figure 4.5.16: Classification <strong>of</strong> <strong>the</strong> training set and test sets in 10-fold-stratified<br />
cross-validation. Data is shown <strong>for</strong> four different classifiers using <strong>the</strong> fingerprint F1<br />
after classification <strong>of</strong> n = 981 spectra “above 37.1 IU/mL TPO antibody” vs. “Control”.<br />
Figure 4.5.17: Classification <strong>of</strong> <strong>the</strong> training set and test sets in 10-fold-stratified<br />
cross-validation. Data is shown <strong>for</strong> four different classifiers using <strong>the</strong> fingerprint F2<br />
after classification <strong>of</strong> n = 450 spectra “above 98.1 IU/mL Tg antibody” vs. “Control”.<br />
Figure 4.5.18: Classification <strong>of</strong> <strong>the</strong> training set and test sets in 10-fold-stratified<br />
cross-validation. Data is shown <strong>for</strong> four different classifiers using <strong>the</strong> fingerprints F1<br />
& F2 after classification <strong>of</strong> n = 1097 spectra “above 37.1 IU/mL TPO antibody” vs.<br />
“above 98.1 IU/mL Tg antibody”.


