

New Statistical Algorithms for the Analysis of Mass - FU Berlin, FB MI ...
New Statistical Algorithms for the Analysis of Mass - FU Berlin, FB MI ...
New Statistical Algorithms for the Analysis of Mass - FU Berlin, FB MI ...

You also want an ePaper? Increase the reach of your titles
YUMPU automatically turns print PDFs into web optimized ePapers that Google loves.
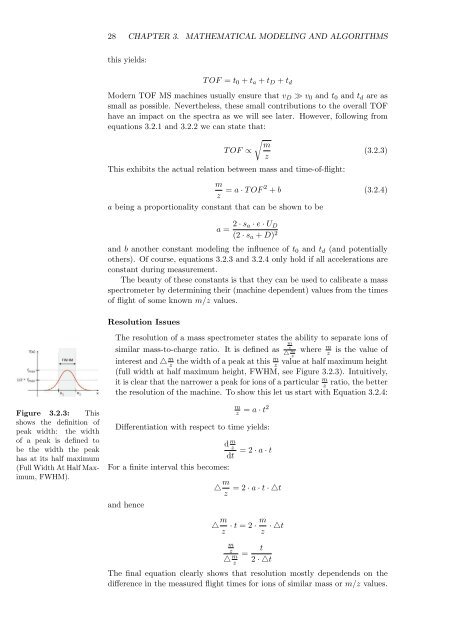
Figure 3.2.3: This<br />
shows <strong>the</strong> definition <strong>of</strong><br />
peak width: <strong>the</strong> width<br />
<strong>of</strong> a peak is defined to<br />
be <strong>the</strong> width <strong>the</strong> peak<br />
has at its half maximum<br />
(Full Width At Half Maximum,<br />
FWHM).<br />
28 CHAPTER 3. MATHEMATICAL MODELING AND ALGORITHMS<br />
this yields:<br />
T OF = t0 + ta + tD + td<br />
Modern TOF MS machines usually ensure that vD ≫ v0 and t0 and td are as<br />
small as possible. Never<strong>the</strong>less, <strong>the</strong>se small contributions to <strong>the</strong> overall TOF<br />
have an impact on <strong>the</strong> spectra as we will see later. However, following from<br />
equations 3.2.1 and 3.2.2 we can state that:<br />
�<br />
m<br />
T OF ∝<br />
(3.2.3)<br />
z<br />
This exhibits <strong>the</strong> actual relation between mass and time-<strong>of</strong>-flight:<br />
m<br />
z = a · T OF 2 + b (3.2.4)<br />
a being a proportionality constant that can be shown to be<br />
a = 2 · sa · e · UD<br />
(2 · sa + D) 2<br />
and b ano<strong>the</strong>r constant modeling <strong>the</strong> influence <strong>of</strong> t0 and td (and potentially<br />
o<strong>the</strong>rs). Of course, equations 3.2.3 and 3.2.4 only hold if all accelerations are<br />
constant during measurement.<br />
The beauty <strong>of</strong> <strong>the</strong>se constants is that <strong>the</strong>y can be used to calibrate a mass<br />
spectrometer by determining <strong>the</strong>ir (machine dependent) values from <strong>the</strong> times<br />
<strong>of</strong> flight <strong>of</strong> some known m/z values.<br />
Resolution Issues<br />
The resolution <strong>of</strong> a mass spectrometer states <strong>the</strong> ability to separate ions <strong>of</strong><br />
similar mass-to-charge ratio. It is defined as m<br />
z<br />
△ m where<br />
z<br />
m<br />
z is <strong>the</strong> value <strong>of</strong><br />
interest and △ m<br />
m<br />
z <strong>the</strong> width <strong>of</strong> a peak at this z value at half maximum height<br />
(full width at half maximum height, FWHM, see Figure 3.2.3). Intuitively,<br />
it is clear that <strong>the</strong> narrower a peak <strong>for</strong> ions <strong>of</strong> a particular m<br />
z ratio, <strong>the</strong> better<br />
<strong>the</strong> resolution <strong>of</strong> <strong>the</strong> machine. To show this let us start with Equation 3.2.4:<br />
m<br />
z<br />
= a · t2<br />
Differentiation with respect to time yields:<br />
d m<br />
z<br />
dt<br />
For a finite interval this becomes:<br />
and hence<br />
△ m<br />
z<br />
△ m<br />
z<br />
= 2 · a · t<br />
= 2 · a · t · △t<br />
· t = 2 · m<br />
z<br />
m<br />
z<br />
△ m<br />
z<br />
= t<br />
2 · △t<br />
· △t<br />
The final equation clearly shows that resolution mostly dependends on <strong>the</strong><br />
difference in <strong>the</strong> measured flight times <strong>for</strong> ions <strong>of</strong> similar mass or m/z values.


