

New Statistical Algorithms for the Analysis of Mass - FU Berlin, FB MI ...
New Statistical Algorithms for the Analysis of Mass - FU Berlin, FB MI ...
New Statistical Algorithms for the Analysis of Mass - FU Berlin, FB MI ...

Create successful ePaper yourself
Turn your PDF publications into a flip-book with our unique Google optimized e-Paper software.
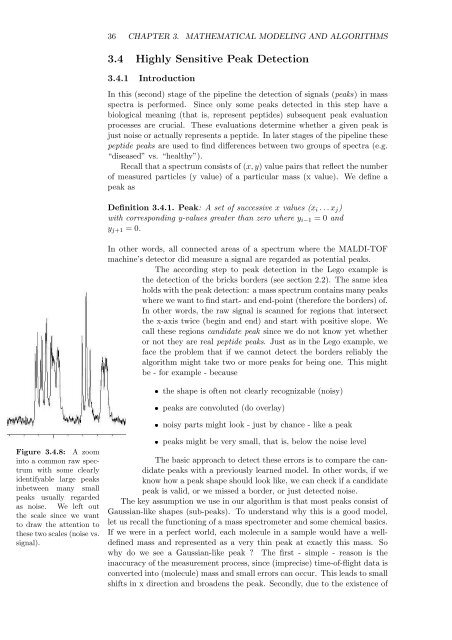
Figure 3.4.8: A zoom<br />
into a common raw spectrum<br />
with some clearly<br />
identifyable large peaks<br />
inbetween many small<br />
peaks usually regarded<br />
as noise. We left out<br />
<strong>the</strong> scale since we want<br />
to draw <strong>the</strong> attention to<br />
<strong>the</strong>se two scales (noise vs.<br />
signal).<br />
36 CHAPTER 3. MATHEMATICAL MODELING AND ALGORITHMS<br />
3.4 Highly Sensitive Peak Detection<br />
3.4.1 Introduction<br />
In this (second) stage <strong>of</strong> <strong>the</strong> pipeline <strong>the</strong> detection <strong>of</strong> signals (peaks) in mass<br />
spectra is per<strong>for</strong>med. Since only some peaks detected in this step have a<br />
biological meaning (that is, represent peptides) subsequent peak evaluation<br />
processes are crucial. These evaluations determine whe<strong>the</strong>r a given peak is<br />
just noise or actually represents a peptide. In later stages <strong>of</strong> <strong>the</strong> pipeline <strong>the</strong>se<br />
peptide peaks are used to find differences between two groups <strong>of</strong> spectra (e.g.<br />
“diseased” vs. “healthy”).<br />
Recall that a spectrum consists <strong>of</strong> (x, y) value pairs that reflect <strong>the</strong> number<br />
<strong>of</strong> measured particles (y value) <strong>of</strong> a particular mass (x value). We define a<br />
peak as<br />
Definition 3.4.1. Peak: A set <strong>of</strong> successive x values (xi . . . xj)<br />
with corresponding y-values greater than zero where yi−1 = 0 and<br />
yj+1 = 0.<br />
In o<strong>the</strong>r words, all connected areas <strong>of</strong> a spectrum where <strong>the</strong> MALDI-TOF<br />
machine’s detector did measure a signal are regarded as potential peaks.<br />
The according step to peak detection in <strong>the</strong> Lego example is<br />
<strong>the</strong> detection <strong>of</strong> <strong>the</strong> bricks borders (see section 2.2). The same idea<br />
holds with <strong>the</strong> peak detection: a mass spectrum contains many peaks<br />
where we want to find start- and end-point (<strong>the</strong>re<strong>for</strong>e <strong>the</strong> borders) <strong>of</strong>.<br />
In o<strong>the</strong>r words, <strong>the</strong> raw signal is scanned <strong>for</strong> regions that intersect<br />
<strong>the</strong> x-axis twice (begin and end) and start with positive slope. We<br />
call <strong>the</strong>se regions candidate peak since we do not know yet whe<strong>the</strong>r<br />
or not <strong>the</strong>y are real peptide peaks. Just as in <strong>the</strong> Lego example, we<br />
face <strong>the</strong> problem that if we cannot detect <strong>the</strong> borders reliably <strong>the</strong><br />
algorithm might take two or more peaks <strong>for</strong> being one. This might<br />
be - <strong>for</strong> example - because<br />
� <strong>the</strong> shape is <strong>of</strong>ten not clearly recognizable (noisy)<br />
� peaks are convoluted (do overlay)<br />
� noisy parts might look - just by chance - like a peak<br />
� peaks might be very small, that is, below <strong>the</strong> noise level<br />
The basic approach to detect <strong>the</strong>se errors is to compare <strong>the</strong> candidate<br />
peaks with a previously learned model. In o<strong>the</strong>r words, if we<br />
know how a peak shape should look like, we can check if a candidate<br />
peak is valid, or we missed a border, or just detected noise.<br />
The key assumption we use in our algorithm is that most peaks consist <strong>of</strong><br />
Gaussian-like shapes (sub-peaks). To understand why this is a good model,<br />
let us recall <strong>the</strong> functioning <strong>of</strong> a mass spectrometer and some chemical basics.<br />
If we were in a perfect world, each molecule in a sample would have a welldefined<br />
mass and represented as a very thin peak at exactly this mass. So<br />
why do we see a Gaussian-like peak ? The first - simple - reason is <strong>the</strong><br />
inaccuracy <strong>of</strong> <strong>the</strong> measurement process, since (imprecise) time-<strong>of</strong>-flight data is<br />
converted into (molecule) mass and small errors can occur. This leads to small<br />
shifts in x direction and broadens <strong>the</strong> peak. Secondly, due to <strong>the</strong> existence <strong>of</strong>


