Diploma thesis
Diploma thesis
Diploma thesis

You also want an ePaper? Increase the reach of your titles
YUMPU automatically turns print PDFs into web optimized ePapers that Google loves.
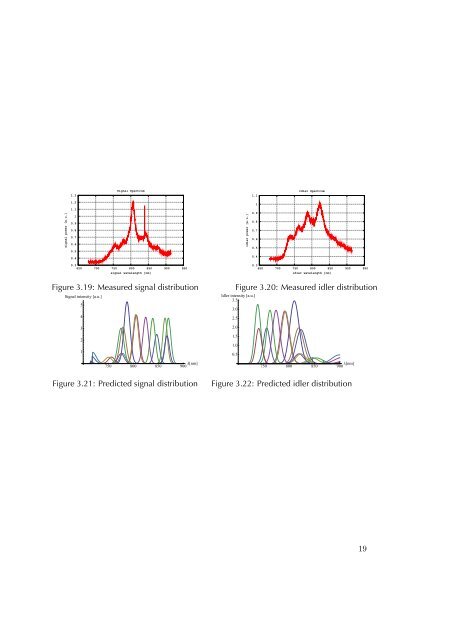
signal power [a.u.]<br />
1.3<br />
1.2<br />
1.1<br />
1<br />
0.9<br />
0.8<br />
0.7<br />
0.6<br />
0.5<br />
0.4<br />
Signal Spectrum<br />
0.3<br />
650 700 750 800 850 900 950<br />
signal wavelength [nm]<br />
Figure 3.19: Measured signal distribution<br />
Signal intensity �a.u.�<br />
5<br />
4<br />
3<br />
2<br />
1<br />
750 800 850 900 Λ�nm�<br />
Figure 3.21: Predicted signal distribution<br />
idler power [a.u.]<br />
1.1<br />
1<br />
0.9<br />
0.8<br />
0.7<br />
0.6<br />
0.5<br />
0.4<br />
Idler Spectrum<br />
0.3<br />
650 700 750 800 850 900 950<br />
idler wavelength [nm]<br />
Figure 3.20: Measured idler distribution<br />
Idler intensity �a.u.�<br />
3.5<br />
3.0<br />
2.5<br />
2.0<br />
1.5<br />
1.0<br />
0.5<br />
750 800 850 900 Λ�nm�<br />
Figure 3.22: Predicted idler distribution<br />
19