Diploma thesis
Diploma thesis
Diploma thesis

Create successful ePaper yourself
Turn your PDF publications into a flip-book with our unique Google optimized e-Paper software.
Gaussian functions. The result is a Gaussian distribution doubled in width and<br />
doubled in central frequency:<br />
I3(ω3) = K ′ e − (ω 3 −2ωp)2<br />
4σ 2 p . (4.8)<br />
With this formula, we can now map our measured pump data points into the expected<br />
SHG spectrum by a simple transformation:<br />
I(λp) → I<br />
� �2 λp<br />
, I(ωp) → I(2ωp)<br />
2<br />
2 . (4.9)<br />
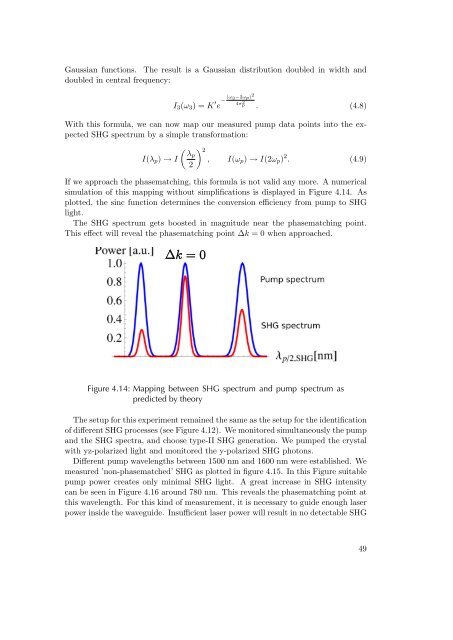
If we approach the phasematching, this formula is not valid any more. A numerical<br />
simulation of this mapping without simplifications is displayed in Figure 4.14. As<br />
plotted, the sinc function determines the conversion efficiency from pump to SHG<br />
light.<br />
The SHG spectrum gets boosted in magnitude near the phasematching point.<br />
This effect will reveal the phasematching point ∆k = 0 when approached.<br />
Figure 4.14: Mapping between SHG spectrum and pump spectrum as<br />
predicted by theory<br />
The setup for this experiment remained the same as the setup for the identification<br />
of different SHG processes (see Figure 4.12). We monitored simultaneously the pump<br />
and the SHG spectra, and choose type-II SHG generation. We pumped the crystal<br />
with yz-polarized light and monitored the y-polarized SHG photons.<br />
Different pump wavelengths between 1500 nm and 1600 nm were established. We<br />
measured ’non-phasematched’ SHG as plotted in figure 4.15. In this Figure suitable<br />
pump power creates only minimal SHG light. A great increase in SHG intensity<br />
can be seen in Figure 4.16 around 780 nm. This reveals the phasematching point at<br />
this wavelength. For this kind of measurement, it is necessary to guide enough laser<br />
power inside the waveguide. Insufficient laser power will result in no detectable SHG<br />
49