Diploma thesis
Diploma thesis
Diploma thesis

Create successful ePaper yourself
Turn your PDF publications into a flip-book with our unique Google optimized e-Paper software.
kSHG(762.5nm) 14.5506/ µm<br />
kp1(1525nm) 7.15375 / µm<br />
kp2(1525nm) 7.48836 / µm<br />
kΛ=104.17µm 0.0603166 / µm<br />
-0.01335 / µm<br />
kerr<br />
Table 4.3: Calculated k-vectors at the degeneracy point<br />
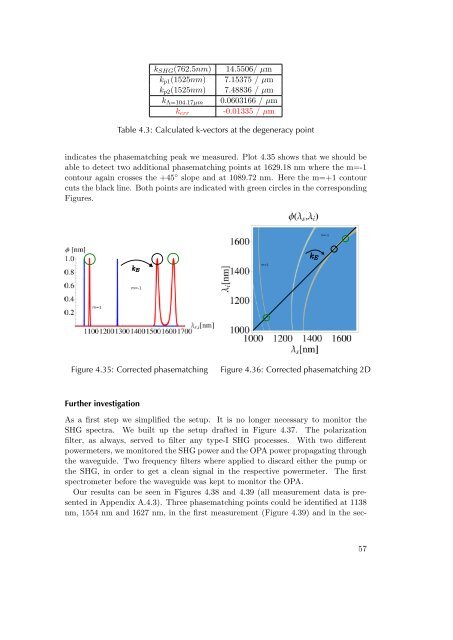
indicates the phasematching peak we measured. Plot 4.35 shows that we should be<br />
able to detect two additional phasematching points at 1629.18 nm where the m=-1<br />
contour again crosses the +45 ◦ slope and at 1089.72 nm. Here the m=+1 contour<br />
cuts the black line. Both points are indicated with green circles in the corresponding<br />
Figures.<br />
Figure 4.35: Corrected phasematching Figure 4.36: Corrected phasematching 2D<br />
Further investigation<br />
As a first step we simplified the setup. It is no longer necessary to monitor the<br />
SHG spectra. We built up the setup drafted in Figure 4.37. The polarization<br />
filter, as always, served to filter any type-I SHG processes. With two different<br />
powermeters, we monitored the SHG power and the OPA power propagating through<br />
the waveguide. Two frequency filters where applied to discard either the pump or<br />
the SHG, in order to get a clean signal in the respective powermeter. The first<br />
spectrometer before the waveguide was kept to monitor the OPA.<br />
Our results can be seen in Figures 4.38 and 4.39 (all measurement data is presented<br />
in Appendix A.4.3). Three phasematching points could be identified at 1138<br />
nm, 1554 nm and 1627 nm, in the first measurement (Figure 4.39) and in the sec-<br />
57