Diploma thesis
Diploma thesis
Diploma thesis

Create successful ePaper yourself
Turn your PDF publications into a flip-book with our unique Google optimized e-Paper software.
Pump Power [a.u.]<br />
25000<br />
20000<br />
15000<br />
10000<br />
5000<br />
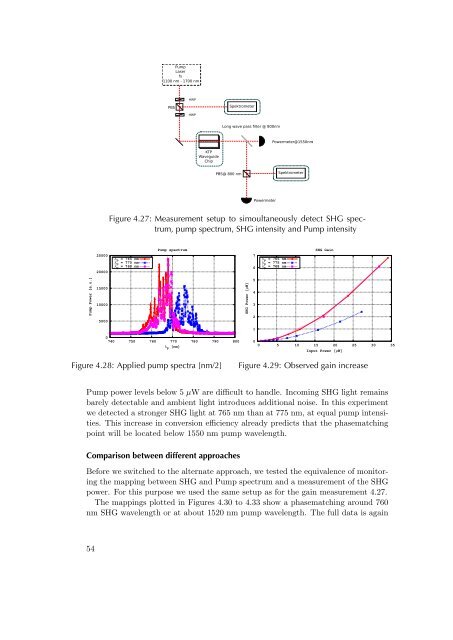
Figure 4.27: Measurement setup to simoultaneously detect SHG spectrum,<br />
pump spectrum, SHG intensity and Pump intensity<br />
λ p = 765 nm<br />
λ p = 775 nm<br />
λ p = 768 nm<br />
Pump spectrum<br />
0<br />
740 750 760 770<br />
λp [nm]<br />
780 790 800<br />
Figure 4.28: Applied pump spectra [nm/2]<br />
SHG Power [µW]<br />
7<br />
6<br />
5<br />
4<br />
3<br />
2<br />
1<br />
λ p = 765 nm<br />
λ p = 775 nm<br />
λ p = 768 nm<br />
SHG Gain<br />
0<br />
0 5 10 15 20 25 30 35<br />
Input Power [µW]<br />
Figure 4.29: Observed gain increase<br />
Pump power levels below 5 µW are difficult to handle. Incoming SHG light remains<br />
barely detectable and ambient light introduces additional noise. In this experiment<br />
we detected a stronger SHG light at 765 nm than at 775 nm, at equal pump intensities.<br />
This increase in conversion efficiency already predicts that the phasematching<br />
point will be located below 1550 nm pump wavelength.<br />
Comparison between different approaches<br />
Before we switched to the alternate approach, we tested the equivalence of monitoring<br />
the mapping between SHG and Pump spectrum and a measurement of the SHG<br />
power. For this purpose we used the same setup as for the gain measurement 4.27.<br />
The mappings plotted in Figures 4.30 to 4.33 show a phasematching around 760<br />
nm SHG wavelength or at about 1520 nm pump wavelength. The full data is again<br />
54