Diploma thesis
Diploma thesis
Diploma thesis
You also want an ePaper? Increase the reach of your titles
YUMPU automatically turns print PDFs into web optimized ePapers that Google loves.
Shg power Pump power [a.u.]<br />
Shg power Pump power [a.u.]<br />
90<br />
80<br />
70<br />
60<br />
50<br />
40<br />
30<br />
20<br />
10<br />
0<br />
Shg spectrum<br />
Pump spectrum<br />
Mapping pump wavelength to shg wavelength<br />
760 780 800 820 840<br />
Shg wavelength [nm] Pump wavelength [nm/2]<br />
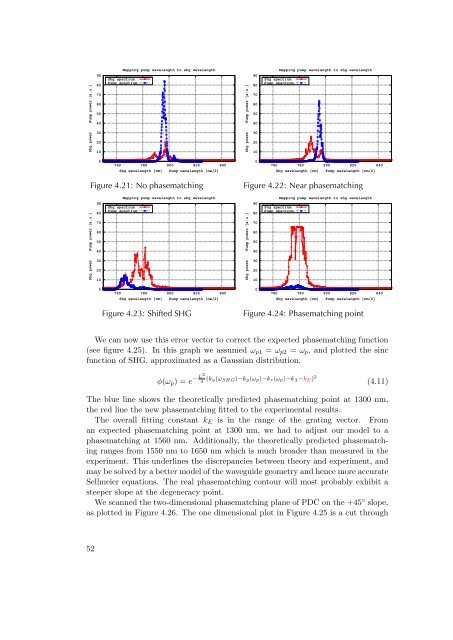
Figure 4.21: No phasematching<br />
90<br />
80<br />
70<br />
60<br />
50<br />
40<br />
30<br />
20<br />
10<br />
0<br />
Shg spectrum<br />
Pump spectrum<br />
Mapping pump wavelength to shg wavelength<br />
760 780 800 820 840<br />
Shg wavelength [nm] Pump wavelength [nm/2]<br />
Figure 4.23: Shifted SHG<br />
Shg power Pump power [a.u.]<br />
90<br />
80<br />
70<br />
60<br />
50<br />
40<br />
30<br />
20<br />
10<br />
0<br />
Shg spectrum<br />
Pump spectrum<br />
Mapping pump wavelength to shg wavelength<br />
760 780 800 820 840<br />
Shg wavelength [nm] Pump wavelength [nm/2]<br />
Figure 4.22: Near phasematching<br />
Shg power Pump power [a.u.]<br />
90<br />
80<br />
70<br />
60<br />
50<br />
40<br />
30<br />
20<br />
10<br />
0<br />
Shg spectrum<br />
Pump spectrum<br />
Mapping pump wavelength to shg wavelength<br />
760 780 800 820 840<br />
Shg wavelength [nm] Pump wavelength [nm/2]<br />
Figure 4.24: Phasematching point<br />
We can now use this error vector to correct the expected phasematching function<br />
(see figure 4.25). In this graph we assumed ωp1 = ωp2 = ωp, and plotted the sinc<br />
function of SHG, approximated as a Gaussian distribution.<br />
φ(ωp) = e<br />
L2<br />
− (ky(ωSHG)−ky(ωp)−kz(ωp)−kΛ−kE) 2<br />
4<br />
(4.11)<br />
The blue line shows the theoretically predicted phasematching point at 1300 nm,<br />
the red line the new phasematching fitted to the experimental results.<br />
The overall fitting constant kE is in the range of the grating vector. From<br />
an expected phasematching point at 1300 nm, we had to adjust our model to a<br />
phasematching at 1560 nm. Additionally, the theoretically predicted phasematching<br />
ranges from 1550 nm to 1650 nm which is much broader than measured in the<br />
experiment. This underlines the discrepancies between theory and experiment, and<br />
may be solved by a better model of the waveguide geometry and hence more accurate<br />
Sellmeier equations. The real phasematching contour will most probably exhibit a<br />
steeper slope at the degeneracy point.<br />
We scanned the two-dimensional phasematching plane of PDC on the +45 ◦ slope,<br />
as plotted in Figure 4.26. The one dimensional plot in Figure 4.25 is a cut through<br />
52


