Diploma thesis
Diploma thesis
Diploma thesis

You also want an ePaper? Increase the reach of your titles
YUMPU automatically turns print PDFs into web optimized ePapers that Google loves.
3.3 Generating pure heralded single photons<br />
We investigate different possibilities to generate pure heralded single photon states<br />
with waveguided PDC. All plots and Schmidt decompositions, in this chapter and<br />
the whole <strong>thesis</strong>, have been performed with consideration of the sinc term in the<br />
two-photon state (Formula 3.22). All pump widths given in this section describe the<br />
width of the pump intensity. This serves the purpose to make this data comparable<br />
to units used in the laboratory.<br />
3.3.1 Spectral filtering<br />
The oldest and most straightforward method to create spectrally decorrelated photon<br />
pairs is the application of spectral filtering. Most nonlinear crystals exhibit a<br />
phasematching contour with a negative slope of -45 ◦ . This frequency distribution<br />
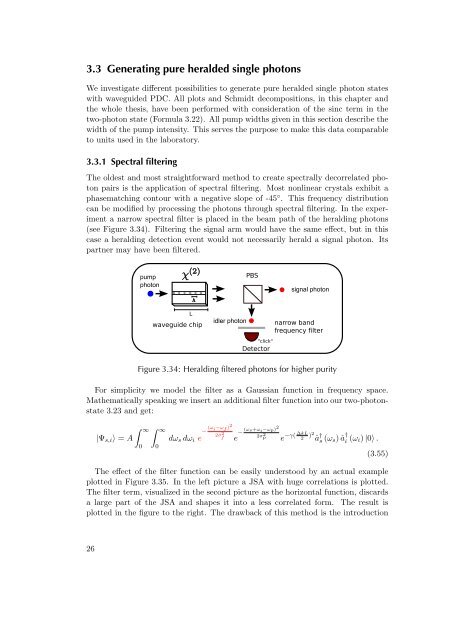
can be modified by processing the photons through spectral filtering. In the experiment<br />
a narrow spectral filter is placed in the beam path of the heralding photons<br />
(see Figure 3.34). Filtering the signal arm would have the same effect, but in this<br />
case a heralding detection event would not necessarily herald a signal photon. Its<br />
partner may have been filtered.<br />
Figure 3.34: Heralding filtered photons for higher purity<br />
For simplicity we model the filter as a Gaussian function in frequency space.<br />
Mathematically speaking we insert an additional filter function into our two-photonstate<br />
3.23 and get:<br />
� ∞ � ∞<br />
|Ψs,i〉 = A<br />
0<br />
0<br />
dωs dωi e − (ωi−ωf )2<br />
2σ2 f e − (ωs+ωi−ωp)2 2σ2 ∆kL<br />
p −γ(<br />
e 2 )2<br />
â † s (ωs) â †<br />
i (ωi) |0〉 .<br />
(3.55)<br />
The effect of the filter function can be easily understood by an actual example<br />
plotted in Figure 3.35. In the left picture a JSA with huge correlations is plotted.<br />
The filter term, visualized in the second picture as the horizontal function, discards<br />
a large part of the JSA and shapes it into a less correlated form. The result is<br />
plotted in the figure to the right. The drawback of this method is the introduction<br />
26