Diploma thesis
Diploma thesis
Diploma thesis

Create successful ePaper yourself
Turn your PDF publications into a flip-book with our unique Google optimized e-Paper software.
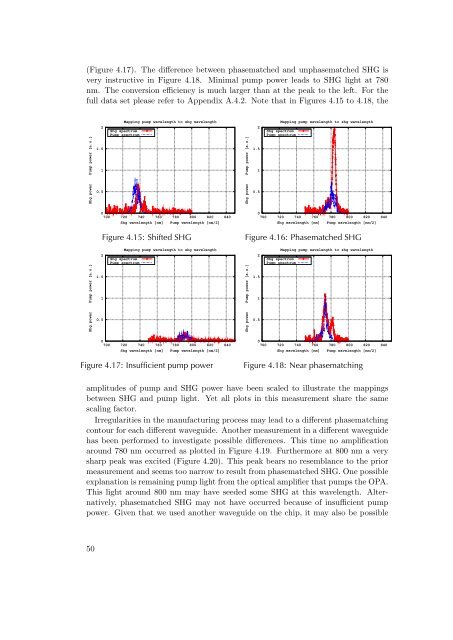
(Figure 4.17). The difference between phasematched and unphasematched SHG is<br />
very instructive in Figure 4.18. Minimal pump power leads to SHG light at 780<br />
nm. The conversion efficiency is much larger than at the peak to the left. For the<br />
full data set please refer to Appendix A.4.2. Note that in Figures 4.15 to 4.18, the<br />
Shg power Pump power [a.u.]<br />
Shg power Pump power [a.u.]<br />
2<br />
1.5<br />
1<br />
0.5<br />
Mapping pump wavelength to shg wavelength<br />
Shg spectrum<br />
Pump spectrum<br />
0<br />
700 720 740 760 780 800 820 840<br />
Shg wavelength [nm] Pump wavelength [nm/2]<br />
Figure 4.15: Shifted SHG<br />
2<br />
1.5<br />
1<br />
0.5<br />
Mapping pump wavelength to shg wavelength<br />
Shg spectrum<br />
Pump spectrum<br />
0<br />
700 720 740 760 780 800 820 840<br />
Shg wavelength [nm] Pump wavelength [nm/2]<br />
Figure 4.17: Insufficient pump power<br />
Shg power Pump power [a.u.]<br />
2<br />
1.5<br />
1<br />
0.5<br />
Mapping pump wavelength to shg wavelength<br />
Shg spectrum<br />
Pump spectrum<br />
0<br />
700 720 740 760 780 800 820 840<br />
Shg wavelength [nm] Pump wavelength [nm/2]<br />
Figure 4.16: Phasematched SHG<br />
Shg power Pump power [a.u.]<br />
2<br />
1.5<br />
1<br />
0.5<br />
Mapping pump wavelength to shg wavelength<br />
Shg spectrum<br />
Pump spectrum<br />
0<br />
700 720 740 760 780 800 820 840<br />
Shg wavelength [nm] Pump wavelength [nm/2]<br />
Figure 4.18: Near phasematching<br />
amplitudes of pump and SHG power have been scaled to illustrate the mappings<br />
between SHG and pump light. Yet all plots in this measurement share the same<br />
scaling factor.<br />
Irregularities in the manufacturing process may lead to a different phasematching<br />
contour for each different waveguide. Another measurement in a different waveguide<br />
has been performed to investigate possible differences. This time no amplification<br />
around 780 nm occurred as plotted in Figure 4.19. Furthermore at 800 nm a very<br />
sharp peak was excited (Figure 4.20). This peak bears no resemblance to the prior<br />
measurement and seems too narrow to result from phasematched SHG. One possible<br />
explanation is remaining pump light from the optical amplifier that pumps the OPA.<br />
This light around 800 nm may have seeded some SHG at this wavelength. Alternatively,<br />
phasematched SHG may not have occurred because of insufficient pump<br />
power. Given that we used another waveguide on the chip, it may also be possible<br />
50