Hijos adultos mayores al cuidado de sus padres, un fenómeno ...
Hijos adultos mayores al cuidado de sus padres, un fenómeno ...
Hijos adultos mayores al cuidado de sus padres, un fenómeno ...

You also want an ePaper? Increase the reach of your titles
YUMPU automatically turns print PDFs into web optimized ePapers that Google loves.
[Consi<strong>de</strong>raciones <strong>de</strong>l Adulto Mayor en UTI - DR. Leonardo Soto G Y COLS.]<br />
vos a pacientes ancianos no representan <strong>de</strong>sventajas <strong>de</strong> supervivencia<br />
asociadas con la edad (6).<br />
En otras p<strong>al</strong>abras, la creencia <strong>de</strong> que los <strong>adultos</strong> <strong>mayores</strong> se mueren<br />
más, sólo a consecuencia <strong>de</strong> su edad, no son soportadas por la evi<strong>de</strong>ncia<br />
actu<strong>al</strong>.<br />
Esta revisión preten<strong>de</strong> an<strong>al</strong>izar los datos loc<strong>al</strong>es respecto a ingresos y<br />
mort<strong>al</strong>idad obtenidos durante los 10 últimos años en la institución y<br />
<strong>de</strong>scribir los princip<strong>al</strong>es cambios fisiológicos asociados a este grupo etario,<br />
que lo hacen <strong>un</strong> subgrupo especi<strong>al</strong> <strong>al</strong> internarse en UTI.<br />
Método<br />
Se re<strong>al</strong>izó estudio <strong>de</strong>scriptivo, observacion<strong>al</strong> retrospectivo con datos estadísticos<br />
<strong>de</strong> ingreso y egreso obtenidos <strong>de</strong> <strong>un</strong>a base <strong>de</strong> datos médica<br />
electrónica <strong>de</strong> Clínica Las Con<strong>de</strong>s. Se utilizaron los datos <strong>de</strong> mort<strong>al</strong>idad<br />
durante <strong>un</strong> periodo <strong>de</strong> 10 años (2000-2010). Se compararon los porcentajes<br />
<strong>de</strong> mort<strong>al</strong>idad entre el grupo <strong>de</strong> menor a 65 años y los ≥ a 65<br />
años. Se usó el test <strong>de</strong> Chi-cuadrado para comparación <strong>de</strong> proporciones<br />
<strong>de</strong> dos grupos in<strong>de</strong>pendientes. Se ev<strong>al</strong>uó la existencia <strong>de</strong> diferencia estadísticamente<br />
significativa entre los grupos.<br />
El grupo ≥ 65 años se estratificó en 3 rangos <strong>de</strong> edad, y se ev<strong>al</strong>uó si<br />
existió diferencia <strong>de</strong> porcentaje <strong>de</strong> mort<strong>al</strong>idad entre ellos.<br />
Resultados<br />
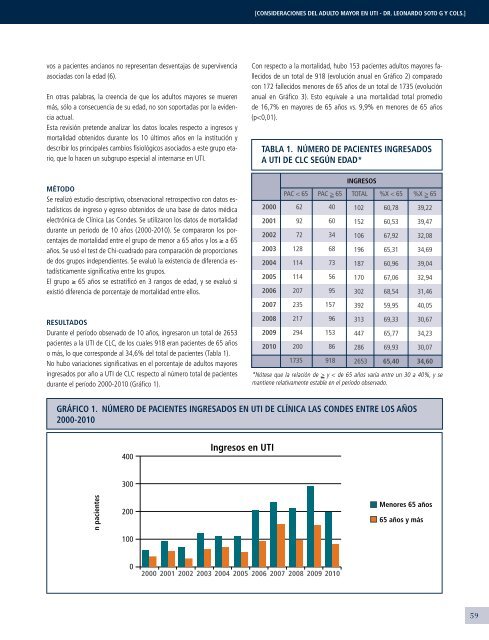
Durante el período observado <strong>de</strong> 10 años, ingresaron <strong>un</strong> tot<strong>al</strong> <strong>de</strong> 2653<br />
pacientes a la UTI <strong>de</strong> CLC, <strong>de</strong> los cu<strong>al</strong>es 918 eran pacientes <strong>de</strong> 65 años<br />
o más, lo que correspon<strong>de</strong> <strong>al</strong> 34,6% <strong>de</strong>l tot<strong>al</strong> <strong>de</strong> pacientes (Tabla 1).<br />
No hubo variaciones significativas en el porcentaje <strong>de</strong> <strong>adultos</strong> <strong>mayores</strong><br />
ingresados por año a UTI <strong>de</strong> CLC respecto <strong>al</strong> número tot<strong>al</strong> <strong>de</strong> pacientes<br />
durante el período 2000-2010 (Gráfico 1).<br />
Con respecto a la mort<strong>al</strong>idad, hubo 153 pacientes <strong>adultos</strong> <strong>mayores</strong> f<strong>al</strong>lecidos<br />
<strong>de</strong> <strong>un</strong> tot<strong>al</strong> <strong>de</strong> 918 (evolución anu<strong>al</strong> en Gráfico 2) comparado<br />
con 172 f<strong>al</strong>lecidos menores <strong>de</strong> 65 años <strong>de</strong> <strong>un</strong> tot<strong>al</strong> <strong>de</strong> 1735 (evolución<br />
anu<strong>al</strong> en Gráfico 3). Esto equiv<strong>al</strong>e a <strong>un</strong>a mort<strong>al</strong>idad tot<strong>al</strong> promedio<br />
<strong>de</strong> 16,7% en <strong>mayores</strong> <strong>de</strong> 65 años vs. 9,9% en menores <strong>de</strong> 65 años<br />
(p 65<br />
40<br />
60<br />
34<br />
68<br />
73<br />
56<br />
95<br />
157<br />
96<br />
153<br />
86<br />
918<br />
TOTAL<br />
102<br />
152<br />
106<br />
196<br />
187<br />
170<br />
302<br />
392<br />
313<br />
447<br />
286<br />
2653<br />
%X < 65<br />
60,78<br />
60,53<br />
67,92<br />
65,31<br />
60,96<br />
67,06<br />
68,54<br />
59,95<br />
69,33<br />
65,77<br />
69,93<br />
65,40<br />
%X > 65<br />
39,22<br />
39,47<br />
32,08<br />
34,69<br />
39,04<br />
32,94<br />
31,46<br />
40,05<br />
30,67<br />
34,23<br />
30,07<br />
34,60<br />
*Nótese que la relación <strong>de</strong> > y < <strong>de</strong> 65 años varía entre <strong>un</strong> 30 a 40%, y se<br />
mantiene relativamente estable en el período observado.<br />
GRÁFICO 1. Número <strong>de</strong> pacientes ingresados en UTI <strong>de</strong> Clínica Las Con<strong>de</strong>s entre los años<br />
2000-2010<br />
400<br />
Ingresos en UTI<br />
300<br />
n pacientes<br />
200<br />
Menores 65 años<br />
65 años y más<br />
100<br />
0<br />
2000 2001 2002 2003 2004 2005 2006 2007 2008 2009 2010<br />
59