Informe Ejecutivo Enero - Diciembre 2012 - Hospital General de ...
Informe Ejecutivo Enero - Diciembre 2012 - Hospital General de ...
Informe Ejecutivo Enero - Diciembre 2012 - Hospital General de ...

Create successful ePaper yourself
Turn your PDF publications into a flip-book with our unique Google optimized e-Paper software.
<strong>Enero</strong> - <strong>Diciembre</strong> <strong>2012</strong><br />
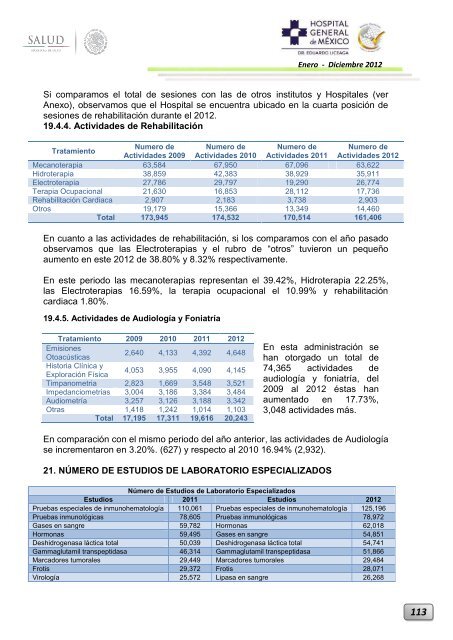
Si comparamos el total <strong>de</strong> sesiones con las <strong>de</strong> otros institutos y <strong>Hospital</strong>es (ver<br />
Anexo), observamos que el <strong>Hospital</strong> se encuentra ubicado en la cuarta posición <strong>de</strong><br />
sesiones <strong>de</strong> rehabilitación durante el <strong>2012</strong>.<br />
19.4.4. Activida<strong>de</strong>s <strong>de</strong> Rehabilitación<br />
Tratamiento<br />
Numero <strong>de</strong> Numero <strong>de</strong> Numero <strong>de</strong> Numero <strong>de</strong><br />
Activida<strong>de</strong>s 2009 Activida<strong>de</strong>s 2010 Activida<strong>de</strong>s 2011 Activida<strong>de</strong>s <strong>2012</strong><br />
Mecanoterapia 63,584 67,950 67,096 63,622<br />
Hidroterapia 38,859 42,383 38,929 35,911<br />
Electroterapia 27,786 29,797 19,290 26,774<br />
Terapia Ocupacional 21,630 16,853 28,112 17,736<br />
Rehabilitación Cardiaca 2,907 2,183 3,738 2,903<br />
Otros 19,179 15,366 13,349 14,460<br />
Total 173,945 174,532 170,514 161,406<br />
En cuanto a las activida<strong>de</strong>s <strong>de</strong> rehabilitación, si los comparamos con el año pasado<br />
observamos que las Electroterapias y el rubro <strong>de</strong> “otros” tuvieron un pequeño<br />
aumento en este <strong>2012</strong> <strong>de</strong> 38.80% y 8.32% respectivamente.<br />
En este periodo las mecanoterapias representan el 39.42%, Hidroterapia 22.25%,<br />
las Electroterapias 16.59%, la terapia ocupacional el 10.99% y rehabilitación<br />
cardiaca 1.80%.<br />
19.4.5. Activida<strong>de</strong>s <strong>de</strong> Audiología y Foniatría<br />
Tratamiento 2009 2010 2011 <strong>2012</strong><br />
Emisiones<br />
Otoacústicas<br />
2,640 4,133 4,392 4,648<br />
Historia Clínica y<br />
Exploración Física<br />
4,053 3,955 4,090 4,145<br />
Timpanometria 2,823 1,669 3,548 3,521<br />
Impedanciometrias 3,004 3,186 3,384 3,484<br />
Audiometría 3,257 3,126 3,188 3,342<br />
Otras 1,418 1,242 1,014 1,103<br />
Total 17,195 17,311 19,616 20,243<br />
En esta administración se<br />
han otorgado un total <strong>de</strong><br />
74,365 activida<strong>de</strong>s <strong>de</strong><br />
audiología y foniatría, <strong>de</strong>l<br />
2009 al <strong>2012</strong> éstas han<br />
aumentado en 17.73%,<br />
3,048 activida<strong>de</strong>s más.<br />
En comparación con el mismo periodo <strong>de</strong>l año anterior, las activida<strong>de</strong>s <strong>de</strong> Audiología<br />
se incrementaron en 3.20%. (627) y respecto al 2010 16.94% (2,932).<br />
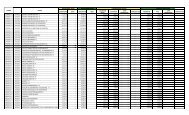
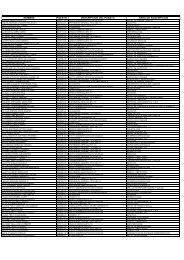
21. NÚMERO DE ESTUDIOS DE LABORATORIO ESPECIALIZADOS<br />
Número <strong>de</strong> Estudios <strong>de</strong> Laboratorio Especializados<br />
Estudios 2011 Estudios <strong>2012</strong><br />
Pruebas especiales <strong>de</strong> inmunohematología 110,061 Pruebas especiales <strong>de</strong> inmunohematología 125,196<br />
Pruebas inmunológicas 78,605 Pruebas inmunológicas 78,972<br />
Gases en sangre 59,782 Hormonas 62,018<br />
Hormonas 59,495 Gases en sangre 54,851<br />
Deshidrogenasa láctica total 50,039 Deshidrogenasa láctica total 54,741<br />
Gammaglutamil transpeptidasa 46,314 Gammaglutamil transpeptidasa 51,866<br />
Marcadores tumorales 29,449 Marcadores tumorales 29,484<br />
Frotis 29,372 Frotis 28,071<br />
Virología 25,572 Lipasa en sangre 26,268<br />
113