Anuario estadÃstico de la banca en España 2012
Anuario estadÃstico de la banca en España 2012
Anuario estadÃstico de la banca en España 2012

Create successful ePaper yourself
Turn your PDF publications into a flip-book with our unique Google optimized e-Paper software.
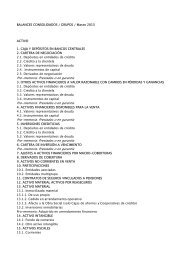
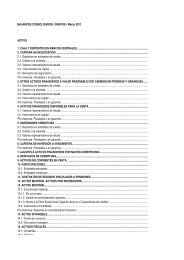
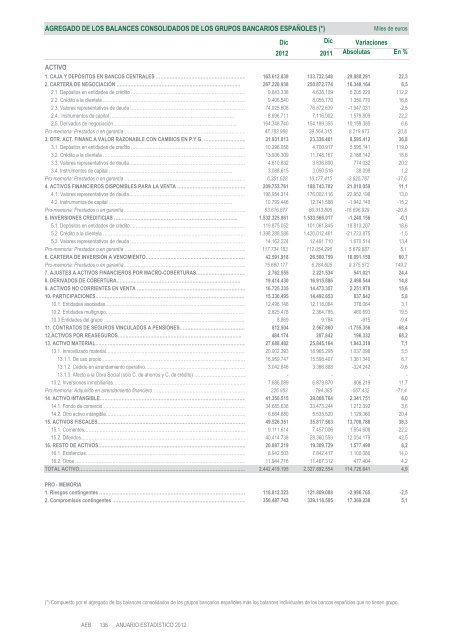
AGREGADO DE LOS BALANCES CONSOLIDADOS DE LOS GRUPOS BANCARIOS ESPAÑOLES (*)<br />
ACTIVO<br />
Miles <strong>de</strong> euros<br />
Dic<br />
Dic Variaciones<br />
<strong>2012</strong> 2011 Absolutas En %<br />
1. CAJA Y DEPÓSITOS EN BANCOS CENTRALES …………………………………………………… 163.612.839 133.732.548 29.880.291 22,3<br />
2. CARTERA DE NEGOCIACIÓN …………………………………………………………………….. 267.220.938 250.872.774 16.348.164 6,5<br />
2.1. Depósitos <strong>en</strong> <strong>en</strong>tida<strong>de</strong>s <strong>de</strong> crédito ………………………………………………………………… 9.843.338 4.638.109 5.205.229 112,2<br />
2.2. Crédito a <strong>la</strong> cli<strong>en</strong>te<strong>la</strong>……………………………………………………………………..…………… 9.406.540 8.055.770 1.350.770 16,8<br />
2.3. Valores repres<strong>en</strong>tativos <strong>de</strong> <strong>de</strong>uda ………………………………………………………………… 74.925.608 76.872.639 -1.947.031 -2,5<br />
2.4. Instrum<strong>en</strong>tos <strong>de</strong> capital …………………………………………………………………….. 8.696.711 7.116.902 1.579.809 22,2<br />
2.5. Derivados <strong>de</strong> negociación…………………………………………………………………….. 164.348.740 154.189.355 10.159.385 6,6<br />
Pro-memoria: Prestados o <strong>en</strong> garantía …………………………………………………………………… 47.783.988 39.564.315 8.219.673 20,8<br />
3. OTR. ACT. FINANC.A VALOR RAZONABLE CON CAMBIOS EN P.Y G. ……………………… 31.931.813 23.336.401 8.595.412 36,8<br />
3.1. Depósitos <strong>en</strong> <strong>en</strong>tida<strong>de</strong>s <strong>de</strong> crédito ………………………………………………………………… 10.296.058 4.700.917 5.595.141 119,0<br />
3.2. Crédito a <strong>la</strong> cli<strong>en</strong>te<strong>la</strong> ……………………………………………………………………..………… 13.936.309 11.748.167 2.188.142 18,6<br />
3.3. Valores repres<strong>en</strong>tativos <strong>de</strong> <strong>de</strong>uda………………………………………………………………… 4.610.832 3.836.800 774.032 20,2<br />
3.4. Instrum<strong>en</strong>tos <strong>de</strong> capital …………………………………………………………………….. 3.088.615 3.050.516 38.099 1,2<br />
Pro-memoria: Prestados o <strong>en</strong> garantía …………………………………………………………………… 6.351.628 10.177.415 -3.825.787 -37,6<br />
4. ACTIVOS FINANCIEROS DISPONIBLES PARA LA VENTA ……………………………………… 209.753.761 188.743.702 21.010.059 11,1<br />
4.1. Valores repres<strong>en</strong>tativos <strong>de</strong> <strong>de</strong>uda………………………………………………………………… 198.954.314 176.002.116 22.952.198 13,0<br />
4.2. Instrum<strong>en</strong>tos <strong>de</strong> capital …………………………………………………………………….. 10.799.446 12.741.586 -1.942.140 -15,2<br />
Pro-memoria: Prestados o <strong>en</strong> garantía……………………………………………………………………. 63.616.877 80.313.806 -16.696.929 -20,8<br />
5. INVERSIONES CREDITICIAS …………………………………………………………………….. 1.532.325.861 1.533.566.017 -1.240.156 -0,1<br />
5.1. Depósitos <strong>en</strong> <strong>en</strong>tida<strong>de</strong>s <strong>de</strong> crédito………………………………………………………………… 119.875.052 101.061.845 18.813.207 18,6<br />
5.2. Crédito a <strong>la</strong> cli<strong>en</strong>te<strong>la</strong> ……………………………………………………………………..………… 1.398.288.586 1.420.012.461 -21.723.875 -1,5<br />
5.3. Valores repres<strong>en</strong>tativos <strong>de</strong> <strong>de</strong>uda ………………………………………………………………… 14.162.224 12.491.710 1.670.514 13,4<br />
Pro-memoria: Prestados o <strong>en</strong> garantía …………………………………………………………………… 117.734.183 112.054.296 5.679.887 5,1<br />
6. CARTERA DE INVERSIÓN A VENCIMIENTO………………………………………………………… 42.591.918 26.500.759 16.091.159 60,7<br />
Pro-memoria: Prestados o <strong>en</strong> garantía……………………………………………………………………. 15.660.177 6.284.605 9.375.572 149,2<br />
7. AJUSTES A ACTIVOS FINANCIEROS POR MACRO-COBERTURAS…………………………… 2.762.555 2.221.534 541.021 24,4<br />
8. DERIVADOS DE COBERTURA…………………………………………………………………….. 19.414.430 16.915.886 2.498.544 14,8<br />
9. ACTIVOS NO CORRIENTES EN VENTA ……………………………………………………………… 16.725.335 14.473.357 2.251.978 15,6<br />
10. PARTICIPACIONES…………………………………………………………………………………… 15.330.495 14.492.653 837.842 5,8<br />
10.1. Entida<strong>de</strong>s asociadas……………………………………………………………………..………… 12.496.148 12.118.084 378.064 3,1<br />
10.2. Entida<strong>de</strong>s multigrupo……………………………………………………………………..………… 2.825.478 2.364.785 460.693 19,5<br />
10.3 Entida<strong>de</strong>s <strong>de</strong>l grupo …………………………………………………………………….………… 8.869 9.784 -915 -9,4<br />
11. CONTRATOS DE SEGUROS VINCULADOS A PENSIONES…………………………………… 812.504 2.567.860 -1.755.356 -68,4<br />
12.ACTIVOS POR REASEGUROS…………………………………………………………………….. 484.174 287.842 196.332 68,2<br />
13. ACTIVO MATERIAL……………………………………………………………………………………… 27.688.482 25.845.164 1.843.318 7,1<br />
13.1. Inmovilizado material……………………………………………………………………..………… 20.002.393 18.965.295 1.037.098 5,5<br />
13.1.1. De uso propio……………………………………………………………………..…………… 16.959.747 15.598.407 1.361.340 8,7<br />
13.1.2. Cedido <strong>en</strong> arr<strong>en</strong>dami<strong>en</strong>to operativo………………………………………………………… 3.042.646 3.366.888 -324.242 -9,6<br />
13.1.3. Afecto a <strong>la</strong> Obra Social (solo C. <strong>de</strong> ahorros y C. <strong>de</strong> crédito) …………………………… - - - -<br />
13.2. Inversiones inmobiliarias……………………………………………………………………..…… 7.686.089 6.879.870 806.219 11,7<br />
Pro-memoria: Adquirido <strong>en</strong> arr<strong>en</strong>dami<strong>en</strong>to financiero…………………………………………………… 226.953 794.385 -567.432 -71,4<br />
14. ACTIVO INTANGIBLE…………………………………………………………………………………… 41.350.515 39.008.764 2.341.751 6,0<br />
14.1. Fondo <strong>de</strong> comercio………………………………………………………………………………… 34.685.636 33.473.244 1.212.392 3,6<br />
14.2. Otro activo intangible……………………………………………………………………………… 6.664.880 5.535.520 1.129.360 20,4<br />
15. ACTIVOS FISCALES…………………………………………………………………………………… 49.526.351 35.817.563 13.708.788 38,3<br />
15.1. Corri<strong>en</strong>tes…………………………………………………………………………………………… 9.111.614 7.457.006 1.654.608 22,2<br />
15.2. Diferidos……………………………………………………………………………………………… 40.414.738 28.360.559 12.054.179 42,5<br />
16. RESTO DE ACTIVOS…………………………………………………………………………………… 20.887.219 19.309.729 1.577.490 8,2<br />
16.1. Exist<strong>en</strong>cias…………………………………………………………………………………………… 8.942.503 7.842.417 1.100.086 14,0<br />
16.2. Otros ………………………………………………………………………………………………… 11.944.716 11.467.312 477.404 4,2<br />
TOTAL ACTIVO……………………………………………………………………………………………… 2.442.419.195 2.327.692.554 114.726.641 4,9<br />
PRO - MEMORIA<br />
1. Riesgos conting<strong>en</strong>tes …………………………………………………………………………………… 118.812.323 121.809.088 -2.996.765 -2,5<br />
2. Compromisos conting<strong>en</strong>tes …………………………………………………………………………… 356.487.743 339.118.505 17.369.238 5,1<br />
(*) Compuesto por el agregado <strong>de</strong> los ba<strong>la</strong>nces consolidados <strong>de</strong> los grupos <strong>banca</strong>rios españoles más los ba<strong>la</strong>nces individuales <strong>de</strong> los bancos españoles que no ti<strong>en</strong><strong>en</strong> grupo.