Anuario estadÃstico de la banca en España 2012
Anuario estadÃstico de la banca en España 2012
Anuario estadÃstico de la banca en España 2012
Create successful ePaper yourself
Turn your PDF publications into a flip-book with our unique Google optimized e-Paper software.
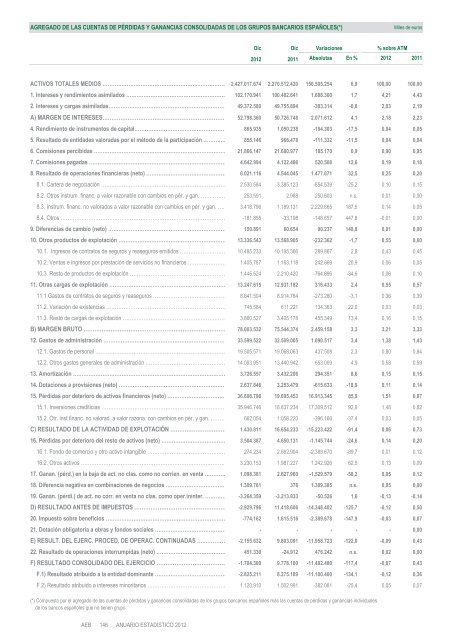
AGREGADO DE LAS CUENTAS DE PÉRDIDAS Y GANANCIAS CONSOLIDADAS DE LOS GRUPOS BANCARIOS ESPAÑOLES(*)<br />
Miles <strong>de</strong> euros<br />
Dic<br />
Dic Variaciones<br />
% sobre ATM<br />
<strong>2012</strong> 2011 Absolutas En % <strong>2012</strong> 2011<br />
ACTIVOS TOTALES MEDIOS ………………………………………………..…………… 2.427.017.674 2.270.512.420 156.505.254 6,9 100,00 100,00<br />
1. Intereses y r<strong>en</strong>dimi<strong>en</strong>tos asimi<strong>la</strong>dos ………………………………………………… 102.170.941 100.482.641 1.688.300 1,7 4,21 4,43<br />
2. Intereses y cargas asimi<strong>la</strong>das…………………………………………………………… 49.372.580 49.755.894 -383.314 -0,8 2,03 2,19<br />
A) MARGEN DE INTERESES…………………………………………………………… 52.798.360 50.726.748 2.071.612 4,1 2,18 2,23<br />
4. R<strong>en</strong>dimi<strong>en</strong>to <strong>de</strong> instrum<strong>en</strong>tos <strong>de</strong> capital……………………………………………… 865.935 1.050.238 -184.303 -17,5 0,04 0,05<br />
5. Resultado <strong>de</strong> <strong>en</strong>tida<strong>de</strong>s valoradas por el método <strong>de</strong> <strong>la</strong> participación ……….… 855.146 966.478 -111.332 -11,5 0,04 0,04<br />
6. Comisiones percibidas …………………………………………………………………… 21.866.147 21.680.977 185.170 0,9 0,90 0,95<br />
7. Comisiones pagadas ……………………………………………………………………… 4.642.994 4.122.486 520.508 12,6 0,19 0,18<br />
8. Resultado <strong>de</strong> operaciones financieras (neto) ………………………………………… 6.021.116 4.544.045 1.477.071 32,5 0,25 0,20<br />
8.1. Cartera <strong>de</strong> negociación ……………………………………………………………… 2.530.584 3.385.123 -854.539 -25,2 0,10 0,15<br />
8.2. Otros instrum. financ. a valor razonable con cambios <strong>en</strong> pér. y gan. …………… 253.591 2.988 250.603 n.s. 0,01 0,00<br />
8.3. Instrum. financ. no valorados a valor razonable con cambios <strong>en</strong> pér. y gan. …… 3.418.796 1.189.131 2.229.665 187,5 0,14 0,05<br />
8.4. Otros …………………………………………………………………………………… -181.855 -33.198 -148.657 447,8 -0,01 0,00<br />
9. Difer<strong>en</strong>cias <strong>de</strong> cambio (neto) …………………………………………………………… 150.891 60.654 90.237 148,8 0,01 0,00<br />
10. Otros productos <strong>de</strong> explotación ……………………………………………………… 13.336.543 13.568.905 -232.362 -1,7 0,55 0,60<br />
10.1. Ingresos <strong>de</strong> contratos <strong>de</strong> seguros y reaseguros emitidos ……………………… 10.485.233 10.195.366 289.867 2,8 0,43 0,45<br />
10.2. V<strong>en</strong>tas e ingresos por prestación <strong>de</strong> servicios no financieros …………………… 1.405.787 1.163.118 242.669 20,9 0,06 0,05<br />
10.3. Resto <strong>de</strong> productos <strong>de</strong> explotación ………………………………………………… 1.445.524 2.210.420 -764.896 -34,6 0,06 0,10<br />
11. Otras cargas <strong>de</strong> explotación …………………………………………………………… 13.247.615 12.931.182 316.433 2,4 0,55 0,57<br />
11.1 Gastos <strong>de</strong> contratos <strong>de</strong> seguros y reaseguros …………………………………… 8.641.504 8.914.784 -273.280 -3,1 0,36 0,39<br />
11.2. Variación <strong>de</strong> exist<strong>en</strong>cias …………………………………………………………… 745.584 611.221 134.363 22,0 0,03 0,03<br />
11.3. Resto <strong>de</strong> cargas <strong>de</strong> explotación …………………………………………………… 3.860.527 3.405.178 455.349 13,4 0,16 0,15<br />
B) MARGEN BRUTO ……………………………………………………………………… 78.003.532 75.544.374 2.459.158 3,3 3,21 3,33<br />
12. Gastos <strong>de</strong> administración ……………………………………………………………… 33.599.522 32.509.005 1.090.517 3,4 1,38 1,43<br />
12.1. Gastos <strong>de</strong> personal ………………………………………………………………… 19.505.571 19.068.063 437.508 2,3 0,80 0,84<br />
12.2. Otros gastos g<strong>en</strong>erales <strong>de</strong> administración ………………………………………… 14.093.951 13.440.942 653.009 4,9 0,58 0,59<br />
13. Amortización ………………………………………………………………………….… 3.726.557 3.432.206 294.351 8,6 0,15 0,15<br />
14. Dotaciones a provisiones (neto) ……………………………………………………… 2.637.846 3.253.479 -615.633 -18,9 0,11 0,14<br />
15. Pérdidas por <strong>de</strong>terioro <strong>de</strong> activos financieros (neto) ……………………………… 36.608.798 19.695.453 16.913.345 85,9 1,51 0,87<br />
15.1. Inversiones crediticias ……………………………………………………………… 35.946.746 18.637.234 17.309.512 92,9 1,48 0,82<br />
15.2. Otr. inst financ. no valorad. a valor razona. con cambios <strong>en</strong> pér. y gan. ……… 662.054 1.058.220 -396.166 -37,4 0,03 0,05<br />
C) RESULTADO DE LA ACTIVIDAD DE EXPLOTACIÓN …………………………… 1.430.811 16.654.233 -15.223.422 -91,4 0,06 0,73<br />
16. Pérdidas por <strong>de</strong>terioro <strong>de</strong>l resto <strong>de</strong> activos (neto) ………………………………… 3.504.387 4.650.131 -1.145.744 -24,6 0,14 0,20<br />
16.1. Fondo <strong>de</strong> comercio y otro activo intangible ……………………………………… 274.234 2.662.904 -2.388.670 -89,7 0,01 0,12<br />
16.2. Otros activos ………………………………………………………………………… 3.230.153 1.987.227 1.242.926 62,5 0,13 0,09<br />
17. Ganan. (pérd.) <strong>en</strong> <strong>la</strong> baja <strong>de</strong> act. no c<strong>la</strong>s. como no corri<strong>en</strong>. <strong>en</strong> v<strong>en</strong>ta ………… 1.098.381 2.627.960 -1.529.579 -58,2 0,05 0,12<br />
18. Difer<strong>en</strong>cia negativa <strong>en</strong> combinaciones <strong>de</strong> negocios ……………………………… 1.309.761 376 1.309.385 n.s. 0,05 0,00<br />
19. Ganan. (pérdi.) <strong>de</strong> act. no corr. <strong>en</strong> v<strong>en</strong>ta no c<strong>la</strong>s. como oper.ininter. ………… -3.264.359 -3.213.833 -50.526 1,6 -0,13 -0,14<br />
D) RESULTADO ANTES DE IMPUESTOS …………………………………………… -2.929.796 11.418.606 -14.348.402 -125,7 -0,12 0,50<br />
20. Impuesto sobre b<strong>en</strong>eficios …………………………………………………………… -774.162 1.615.516 -2.389.678 -147,9 -0,03 0,07<br />
21. Dotación obligatoria a obras y fondos sociales …………………………………… - - - - - 0,00<br />
E) RESULT. DEL EJERC. PROCED. DE OPERAC. CONTINUADAS …..………… -2.155.632 9.803.091 -11.958.723 -122,0 -0,09 0,43<br />
22. Resultado <strong>de</strong> operaciones interrumpidas (neto) …………………………………… 451.330 -24.912 476.242 n.s. 0,02 0,00<br />
F) RESULTADO CONSOLIDADO DEL EJERCICIO ………………………………… -1.704.300 9.778.180 -11.482.480 -117,4 -0,07 0,43<br />
F.1) Resultado atribuido a <strong>la</strong> <strong>en</strong>tidad dominante …………………………………… -2.825.211 8.275.189 -11.100.400 -134,1 -0,12 0,36<br />
F.2) Resultado atribuido a intereses minoritarios ……………………………………… 1.120.910 1.502.991 -382.081 -25,4 0,05 0,07<br />
(*) Compuesto por el agregado <strong>de</strong> <strong>la</strong>s cu<strong>en</strong>tas <strong>de</strong> pérdidas y ganancias consolidadas <strong>de</strong> los grupos <strong>banca</strong>rios españoles más <strong>la</strong>s cu<strong>en</strong>tas <strong>de</strong> pérdidas y ganancias individuales<br />
<strong>de</strong> los bancos españoles que no ti<strong>en</strong><strong>en</strong> grupo.


