Anuario estadÃstico de la banca en España 2012
Anuario estadÃstico de la banca en España 2012
Anuario estadÃstico de la banca en España 2012

You also want an ePaper? Increase the reach of your titles
YUMPU automatically turns print PDFs into web optimized ePapers that Google loves.
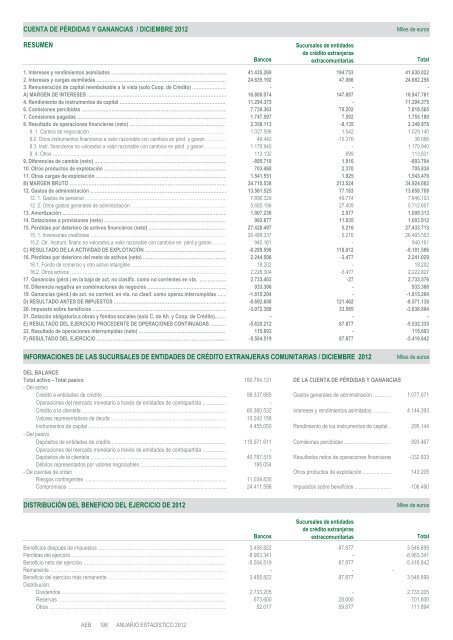
CUENTA DE PÉRDIDAS Y GANANCIAS / DICIEMBRE <strong>2012</strong><br />
Miles <strong>de</strong> euros<br />
RESUMEN<br />
Bancos<br />
Sucursales <strong>de</strong> <strong>en</strong>tida<strong>de</strong>s<br />
<strong>de</strong> crédito extranjeras<br />
extracomunitarias<br />
Total<br />
1. Intereses y r<strong>en</strong>dimi<strong>en</strong>tos asimi<strong>la</strong>dos ………………………………………………………………… 41.435.269 194.753 41.630.022<br />
2. Intereses y cargas asimi<strong>la</strong>das ………………………………………………………………………… 24.635.192 47.066 24.682.258<br />
3. Remuneración <strong>de</strong> capital reembolsable a <strong>la</strong> vista (solo Coop. <strong>de</strong> Crédito) …………………… - - -<br />
A) MARGEN DE INTERESES ……………………………………………………………………………… 16.800.074 147.687 16.947.761<br />
4. R<strong>en</strong>dimi<strong>en</strong>to <strong>de</strong> instrum<strong>en</strong>tos <strong>de</strong> capital …………………………………………………………… 11.294.375 - 11.294.375<br />
6. Comisiones percibidas ………………………………………………………………………………… 7.739.363 79.202 7.818.565<br />
7. Comisiones pagadas …………………………………………………………………………………… 1.747.597 7.592 1.755.189<br />
8. Resultado <strong>de</strong> operaciones financieras (neto) ……………………………………………………… 2.358.113 -8.135 2.349.978<br />
8. 1. Cartera <strong>de</strong> negociación …………………………………………………………………………… 1.027.598 1.542 1.029.140<br />
8.2. Otros instrum<strong>en</strong>tos financieros a valor razonable con cambios <strong>en</strong> pérd. y ganan. ………… 46.442 -10.376 36.066<br />
8.3. Instr. financieros no valorados a valor razonable con cambios <strong>en</strong> pérd. y ganan. .………… 1.170.940 - 1.170.940<br />
8. 4. Otros ………………………………………………………………………………………………… 113.132 699 113.831<br />
9. Difer<strong>en</strong>cias <strong>de</strong> cambio (neto) ………………………………………………………………………… -895.710 1.916 -893.794<br />
10. Otros productos <strong>de</strong> explotación …………………………………………………………………… 703.468 2.370 705.838<br />
11. Otras cargas <strong>de</strong> explotación ………………………………………………………………………… 1.541.551 1.925 1.543.476<br />
B) MARGEN BRUTO ……………………………………………………………………………………… 34.710.538 213.524 34.924.062<br />
12. Gastos <strong>de</strong> administración …………………………………………………………………………… 13.581.525 77.183 13.658.708<br />
12. 1. Gastos <strong>de</strong> personal ……………………………………………………………………………… 7.896.329 49.774 7.946.103<br />
12. 2. Otros gastos g<strong>en</strong>erales <strong>de</strong> administración …………………………………………………… 5.685.198 27.409 5.712.607<br />
13. Amortización …………………………………………………………………………………………… 1.007.236 2.077 1.009.313<br />
14. Dotaciones a provisiones (neto) …………………………………………………………………… 992.877 11.035 1.003.912<br />
15. Pérdidas por <strong>de</strong>terioro <strong>de</strong> activos financieros (neto) …………………………………………… 27.428.497 5.216 27.433.713<br />
15. 1. Inversiones crediticias …………………………………………………………………………… 26.488.337 5.216 26.493.553<br />
15.2. Otr. Instrum. financ.no valorados a valor razonable con cambios <strong>en</strong> pérd.y ganan. ……… 940.161 - 940.161<br />
C) RESULTADO DE LA ACTIVIDAD DE EXPLOTACIÓN …………………………………………… -8.299.598 118.012 -8.181.586<br />
16. Pérdidas por <strong>de</strong>terioro <strong>de</strong>l resto <strong>de</strong> activos (neto) ……………………………………………… 2.244.506 -3.477 2.241.029<br />
16.1. Fondo <strong>de</strong> comercio y otro activo intangible …………………………………………………… 18.202 - 18.202<br />
16.2. Otros activos ……………………………………………………………………………………… 2.226.304 -3.477 2.222.827<br />
17. Ganancias (pérd.) <strong>en</strong> <strong>la</strong> baja <strong>de</strong> act. no c<strong>la</strong>sific. como no corri<strong>en</strong>tes <strong>en</strong> vta. ……………… 2.733.403 -27 2.733.376<br />
18. Difer<strong>en</strong>cia negativa <strong>en</strong> combinaciones <strong>de</strong> negocios …………………………………………… 933.306 - 933.306<br />
19. Ganancias (pérd.) <strong>de</strong> act. no corri<strong>en</strong>t. <strong>en</strong> vta. no c<strong>la</strong>sif. como operac.interrumpidas …… -1.815.204 - -1.815.204<br />
D) RESULTADO ANTES DE IMPUESTOS ……………………………………………………………… -8.692.600 121.462 -8.571.138<br />
20. Impuesto sobre b<strong>en</strong>eficios …………………………………………………………………………… -3.072.389 33.585 -3.038.804<br />
21. Dotación obligatoria a obras y fondos sociales (solo C. <strong>de</strong> Ah. y Coop. <strong>de</strong> Crédito)……… - - -<br />
E) RESULTADO DEL EJERCICIO PROCEDENTE DE OPERACIONES CONTINUADAS ………… -5.620.212 87.877 -5.532.335<br />
22. Resultado <strong>de</strong> operaciones interrumpidas (neto) ………………………………………………… 115.693 - 115.693<br />
F) RESULTADO DEL EJERCICIO …………………………………………………………………….… -5.504.519 87.877 -5.416.642<br />
INFORMACIONES DE LAS SUCURSALES DE ENTIDADES DE CRÉDITO EXTRANJERAS COMUNITARIAS / DICIEMBRE <strong>2012</strong><br />
Miles <strong>de</strong> euros<br />
DEL BALANCE<br />
Total activo –Total pasivo 180.754.131 DE LA CUENTA DE PÉRDIDAS Y GANANCIAS<br />
- Del activo<br />
Crédito a <strong>en</strong>tida<strong>de</strong>s <strong>de</strong> crédito .......................................................................................... 99.337.665 Gastos g<strong>en</strong>erales <strong>de</strong> administración ............. 1.077.071<br />
Operaciones <strong>de</strong>l mercado monetario a través <strong>de</strong> <strong>en</strong>tida<strong>de</strong>s <strong>de</strong> contrapartida ................. -<br />
Crédito a <strong>la</strong> cli<strong>en</strong>te<strong>la</strong> ......................................................................................................... 60.360.532 Intereses y r<strong>en</strong>dimi<strong>en</strong>tos asimi<strong>la</strong>dos ............. 4.144.393<br />
Valores repres<strong>en</strong>tativos <strong>de</strong> <strong>de</strong>uda .................................................................................... 10.242.158<br />
Instrum<strong>en</strong>tos <strong>de</strong> capital ..................................................................................................... 4.455.050 R<strong>en</strong>dimi<strong>en</strong>to <strong>de</strong> los instrum<strong>en</strong>tos <strong>de</strong> capital .. 295.144<br />
- Del pasivo<br />
Depósitos <strong>de</strong> <strong>en</strong>tida<strong>de</strong>s <strong>de</strong> crédito ................................................................................... 119.971.611 Comisiones percibidas .................................. 893.467<br />
Operaciones <strong>de</strong>l mercado monetario a través <strong>de</strong> <strong>en</strong>tida<strong>de</strong>s <strong>de</strong> contrapartida ................. -<br />
Depósitos <strong>de</strong> <strong>la</strong> cli<strong>en</strong>te<strong>la</strong> ................................................................................................... 40.787.515 Resultados netos <strong>de</strong> operaciones financieras -332.833<br />
Débitos repres<strong>en</strong>tados por valores negociables ............................................................... 195.054<br />
- De cu<strong>en</strong>tas <strong>de</strong> or<strong>de</strong>n Otros productos <strong>de</strong> explotación ..................... 143.205<br />
Riesgos conting<strong>en</strong>tes ....................................................................................................... 11.034.835<br />
Compromisos .................................................................................................................... 24.411.598 Impuestos sobre b<strong>en</strong>eficios ........................... -106.490<br />
DISTRIBUCIÓN DEL BENEFICIO DEL EJERCICIO DE <strong>2012</strong><br />
Miles <strong>de</strong> euros<br />
B<strong>en</strong>eficios <strong>de</strong>spués <strong>de</strong> impuestos ………………………………………….………………………… 3.458.822 87.877 3.546.699<br />
Pérdidas <strong>de</strong>l ejercicio………………………………………….………………………………………. -8.963.341 - -8.963.341<br />
B<strong>en</strong>eficio neto <strong>de</strong>l ejercicio ……………………………………………………………..……………… -5.504.519 87.877 -5.416.642<br />
Reman<strong>en</strong>te ……………………………………………………………………………………………… - - -<br />
B<strong>en</strong>eficio <strong>de</strong>l ejercicio más reman<strong>en</strong>te ………………………………………….…………………… 3.458.822 87.877 3.546.699<br />
Distribución:<br />
Divi<strong>de</strong>ndos ………………………………………………………………………………………… 2.733.205 - 2.733.205<br />
Reservas ………………………………………………………………………………………… 673.600 28.000 701.600<br />
Otros ……………………………………………………………………………………………… 52.017 59.877 111.894<br />
Bancos<br />
Sucursales <strong>de</strong> <strong>en</strong>tida<strong>de</strong>s<br />
<strong>de</strong> crédito extranjeras<br />
extracomunitarias<br />
Total