Anuario estadÃstico de la banca en España 2012
Anuario estadÃstico de la banca en España 2012
Anuario estadÃstico de la banca en España 2012

You also want an ePaper? Increase the reach of your titles
YUMPU automatically turns print PDFs into web optimized ePapers that Google loves.
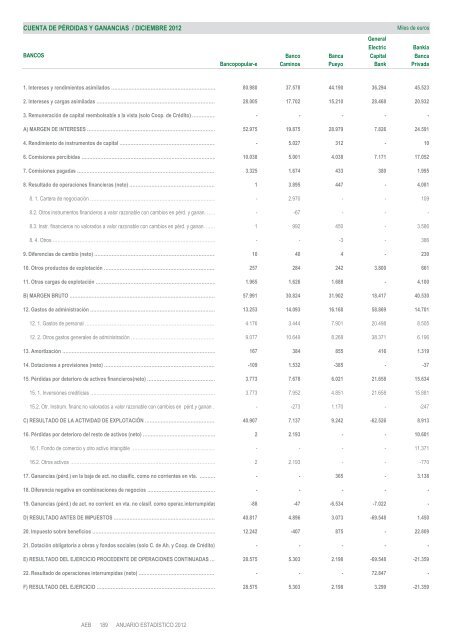
CUENTA DE PÉRDIDAS Y GANANCIAS / DICIEMBRE <strong>2012</strong><br />
Miles <strong>de</strong> euros<br />
G<strong>en</strong>eral<br />
Electric Bankia<br />
BANCOS Banco Banca Capital Banca<br />
Bancopopu<strong>la</strong>r-e Caminos Pueyo Bank Privada<br />
1. Intereses y r<strong>en</strong>dimi<strong>en</strong>tos asimi<strong>la</strong>dos ………………………………………………………… 80.980 37.578 44.190 36.294 45.523<br />
2. Intereses y cargas asimi<strong>la</strong>das ………………………………………………………………… 28.005 17.702 15.210 28.468 20.932<br />
3. Remuneración <strong>de</strong> capital reembolsable a <strong>la</strong> vista (solo Coop. <strong>de</strong> Crédito) …………… - - - - -<br />
A) MARGEN DE INTERESES ……………………………………………………………………… 52.975 19.875 28.979 7.826 24.591<br />
4. R<strong>en</strong>dimi<strong>en</strong>to <strong>de</strong> instrum<strong>en</strong>tos <strong>de</strong> capital ……………………………………………………… - 5.027 312 - 10<br />
6. Comisiones percibidas …………………………………………………………………………… 10.038 5.001 4.038 7.171 17.052<br />
7. Comisiones pagadas ……………………………………………………………………………… 3.325 1.674 433 380 1.995<br />
8. Resultado <strong>de</strong> operaciones financieras (neto) ………………………………………………… 1 3.895 447 - 4.081<br />
8. 1. Cartera <strong>de</strong> negociación ……………………………………………………………………… - 2.970 - - 109<br />
8.2. Otros instrum<strong>en</strong>tos financieros a valor razonable con cambios <strong>en</strong> pérd. y ganan. …… - -67 - - -<br />
8.3. Instr. financieros no valorados a valor razonable con cambios <strong>en</strong> pérd. y ganan. .…… 1 992 450 - 3.586<br />
8. 4. Otros …………………………………………………………………………………………… - - -3 - 386<br />
9. Difer<strong>en</strong>cias <strong>de</strong> cambio (neto) …………………………………………………………………… 10 40 4 - 230<br />
10. Otros productos <strong>de</strong> explotación ……………………………………………………………… 257 284 242 3.800 661<br />
11. Otras cargas <strong>de</strong> explotación …………………………………………………………………… 1.965 1.626 1.688 - 4.100<br />
B) MARGEN BRUTO ………………………………………………………………………………… 57.991 30.824 31.902 18.417 40.530<br />
12. Gastos <strong>de</strong> administración ……………………………………………………………………… 13.253 14.093 16.168 58.869 14.701<br />
12. 1. Gastos <strong>de</strong> personal ………………………………………………………………………… 4.176 3.444 7.901 20.498 8.505<br />
12. 2. Otros gastos g<strong>en</strong>erales <strong>de</strong> administración ……………………………………………… 9.077 10.649 8.268 38.371 6.196<br />
13. Amortización ……………………………………………………………………………………… 167 384 855 416 1.319<br />
14. Dotaciones a provisiones (neto) ……………………………………………………………… -109 1.532 -385 - -37<br />
15. Pérdidas por <strong>de</strong>terioro <strong>de</strong> activos financieros(neto) ……………………………………… 3.773 7.678 6.021 21.658 15.634<br />
15. 1. Inversiones crediticias ……………………………………………………………………… 3.773 7.952 4.851 21.658 15.881<br />
15.2. Otr. Instrum. financ.no valorados a valor razonable con cambios <strong>en</strong> pérd.y ganan … - -273 1.170 - -247<br />
C) RESULTADO DE LA ACTIVIDAD DE EXPLOTACIÓN ……………………………………… 40.907 7.137 9.242 -62.526 8.913<br />
16. Pérdidas por <strong>de</strong>terioro <strong>de</strong>l resto <strong>de</strong> activos (neto) ………………………………………… 2 2.193 - - 10.601<br />
16.1. Fondo <strong>de</strong> comercio y otro activo intangible ……………………………………………… - - - - 11.371<br />
16.2. Otros activos ………………………………………………………………………………… 2 2.193 - - -770<br />
17. Ganancias (pérd.) <strong>en</strong> <strong>la</strong> baja <strong>de</strong> act. no c<strong>la</strong>sific. como no corri<strong>en</strong>tes <strong>en</strong> vta. ………… - - 365 - 3.138<br />
18. Difer<strong>en</strong>cia negativa <strong>en</strong> combinaciones <strong>de</strong> negocios ……………………………………… - - - - -<br />
19. Ganancias (pérd.) <strong>de</strong> act. no corri<strong>en</strong>t. <strong>en</strong> vta. no c<strong>la</strong>sif. como operac.interrumpidas -88 -47 -6.534 -7.022 -<br />
D) RESULTADO ANTES DE IMPUESTOS ………………………………………………………… 40.817 4.896 3.073 -69.548 1.450<br />
20. Impuesto sobre b<strong>en</strong>eficios …………………………………………………………………… 12.242 -407 875 - 22.809<br />
21. Dotación obligatoria a obras y fondos sociales (solo C. <strong>de</strong> Ah. y Coop. <strong>de</strong> Crédito) - - - - -<br />
E) RESULTADO DEL EJERCICIO PROCEDENTE DE OPERACIONES CONTINUADAS …… 28.575 5.303 2.198 -69.548 -21.359<br />
22. Resultado <strong>de</strong> operaciones interrumpidas (neto) …………………………………………… - - - 72.847 -<br />
F) RESULTADO DEL EJERCICIO ………………………………………………………………… 28.575 5.303 2.198 3.299 -21.359