Anuario estadÃstico de la banca en España 2012
Anuario estadÃstico de la banca en España 2012
Anuario estadÃstico de la banca en España 2012

You also want an ePaper? Increase the reach of your titles
YUMPU automatically turns print PDFs into web optimized ePapers that Google loves.
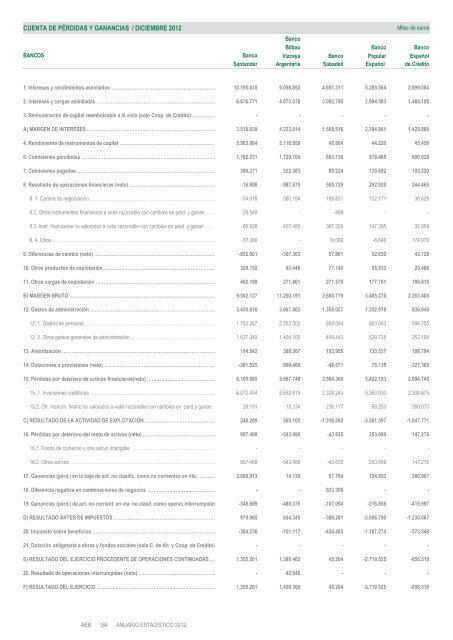
CUENTA DE PÉRDIDAS Y GANANCIAS / DICIEMBRE <strong>2012</strong><br />
Miles <strong>de</strong> euros<br />
Banco<br />
Bilbao Banco Banco<br />
BANCOS Banco Vizcaya Banco Popu<strong>la</strong>r Español<br />
Santan<strong>de</strong>r Arg<strong>en</strong>taria Saba<strong>de</strong>ll Español <strong>de</strong> Crédito<br />
1. Intereses y r<strong>en</strong>dimi<strong>en</strong>tos asimi<strong>la</strong>dos ………………………………………………………… 10.195.610 9.098.892 4.651.311 5.289.564 2.899.084<br />
2. Intereses y cargas asimi<strong>la</strong>das ………………………………………………………………… 6.676.771 4.875.078 3.092.795 2.894.583 1.469.195<br />
3. Remuneración <strong>de</strong> capital reembolsable a <strong>la</strong> vista (solo Coop. <strong>de</strong> Crédito) …………… - - - - -<br />
A) MARGEN DE INTERESES ……………………………………………………………………… 3.518.839 4.223.814 1.558.516 2.394.981 1.429.889<br />
4. R<strong>en</strong>dimi<strong>en</strong>to <strong>de</strong> instrum<strong>en</strong>tos <strong>de</strong> capital ……………………………………………………… 5.563.084 5.116.959 48.604 44.220 45.450<br />
6. Comisiones percibidas …………………………………………………………………………… 1.762.231 1.729.700 693.736 878.465 690.028<br />
7. Comisiones pagadas ……………………………………………………………………………… 399.271 322.383 89.224 135.692 103.220<br />
8. Resultado <strong>de</strong> operaciones financieras (neto) ………………………………………………… -16.808 987.679 585.725 292.920 244.465<br />
8. 1. Cartera <strong>de</strong> negociación ……………………………………………………………………… -54.916 580.194 199.831 152.171 36.629<br />
8.2. Otros instrum<strong>en</strong>tos financieros a valor razonable con cambios <strong>en</strong> pérd. y ganan. …… 29.548 - -498 - -<br />
8.3. Instr. financieros no valorados a valor razonable con cambios <strong>en</strong> pérd. y ganan. .…… 65.926 407.485 367.326 147.395 32.858<br />
8. 4. Otros …………………………………………………………………………………………… -57.366 - 19.066 -6.646 174.978<br />
9. Difer<strong>en</strong>cias <strong>de</strong> cambio (neto) …………………………………………………………………… -852.901 -307.363 57.861 52.630 43.128<br />
10. Otros productos <strong>de</strong> explotación ……………………………………………………………… 329.152 93.446 77.140 55.533 20.486<br />
11. Otras cargas <strong>de</strong> explotación …………………………………………………………………… 402.199 271.661 271.579 177.781 106.818<br />
B) MARGEN BRUTO ………………………………………………………………………………… 9.502.127 11.250.191 2.660.779 3.405.276 2.263.408<br />
12. Gastos <strong>de</strong> administración ……………………………………………………………………… 3.430.616 3.667.602 1.358.027 1.332.818 836.949<br />
12. 1. Gastos <strong>de</strong> personal ………………………………………………………………………… 1.793.267 2.263.502 858.584 803.083 584.755<br />
12. 2. Otros gastos g<strong>en</strong>erales <strong>de</strong> administración ……………………………………………… 1.637.349 1.404.100 499.443 529.735 252.194<br />
13. Amortización ……………………………………………………………………………………… 104.542 380.267 103.955 133.537 106.794<br />
14. Dotaciones a provisiones (neto) ……………………………………………………………… -381.925 969.468 -48.671 78.135 -327.309<br />
15. Pérdidas por <strong>de</strong>terioro <strong>de</strong> activos financieros(neto) ……………………………………… 6.100.685 5.667.749 2.564.360 5.422.183 2.694.745<br />
15. 1. Inversiones crediticias ……………………………………………………………………… 6.072.494 5.652.615 2.328.243 5.353.930 2.304.675<br />
15.2. Otr. Instrum. financ.no valorados a valor razonable con cambios <strong>en</strong> pérd.y ganan … 28.191 15.134 236.117 68.253 390.070<br />
C) RESULTADO DE LA ACTIVIDAD DE EXPLOTACIÓN ……………………………………… 248.209 565.105 -1.316.892 -3.561.397 -1.047.771<br />
16. Pérdidas por <strong>de</strong>terioro <strong>de</strong>l resto <strong>de</strong> activos (neto) ………………………………………… 997.468 -543.486 -43.635 253.099 147.276<br />
16.1. Fondo <strong>de</strong> comercio y otro activo intangible ……………………………………………… - - - - -<br />
16.2. Otros activos ………………………………………………………………………………… 997.468 -543.486 -43.635 253.099 147.276<br />
17. Ganancias (pérd.) <strong>en</strong> <strong>la</strong> baja <strong>de</strong> act. no c<strong>la</strong>sific. como no corri<strong>en</strong>tes <strong>en</strong> vta. ………… 2.068.913 14.130 57.764 124.553 380.967<br />
18. Difer<strong>en</strong>cia negativa <strong>en</strong> combinaciones <strong>de</strong> negocios ……………………………………… - - 933.306 - -<br />
19. Ganancias (pérd.) <strong>de</strong> act. no corri<strong>en</strong>t. <strong>en</strong> vta. no c<strong>la</strong>sif. como operac.interrumpidas -348.689 -488.376 -107.094 -216.856 -415.987<br />
D) RESULTADO ANTES DE IMPUESTOS ………………………………………………………… 970.965 634.345 -389.281 -3.906.799 -1.230.067<br />
20. Impuesto sobre b<strong>en</strong>eficios …………………………………………………………………… -384.236 -751.117 -434.485 -1.187.274 -373.548<br />
21. Dotación obligatoria a obras y fondos sociales (solo C. <strong>de</strong> Ah. y Coop. <strong>de</strong> Crédito) - - - - -<br />
E) RESULTADO DEL EJERCICIO PROCEDENTE DE OPERACIONES CONTINUADAS …… 1.355.201 1.385.462 45.204 -2.719.525 -856.519<br />
22. Resultado <strong>de</strong> operaciones interrumpidas (neto) …………………………………………… - 42.846 - - -<br />
F) RESULTADO DEL EJERCICIO ………………………………………………………………… 1.355.201 1.428.308 45.204 -2.719.525 -856.519