Anuario estadÃstico de la banca en España 2012
Anuario estadÃstico de la banca en España 2012
Anuario estadÃstico de la banca en España 2012

You also want an ePaper? Increase the reach of your titles
YUMPU automatically turns print PDFs into web optimized ePapers that Google loves.
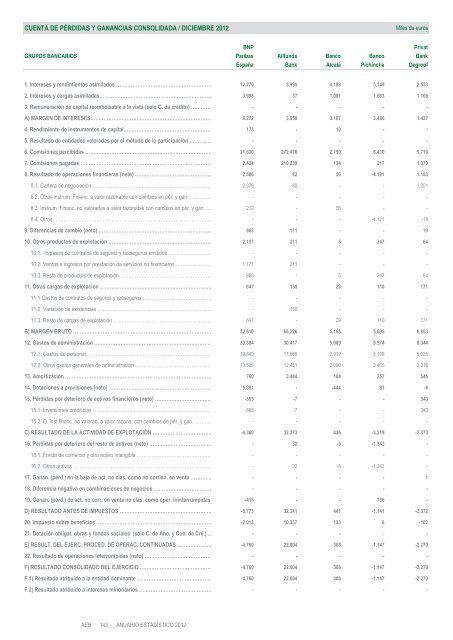
CUENTA DE PÉRDIDAS Y GANANCIAS CONSOLIDADA / DICIEMBRE <strong>2012</strong><br />
Miles <strong>de</strong> euros<br />
BNP<br />
Privat<br />
GRUPOS BANCARIOS Paribas Allfunds Banco Banco Bank<br />
España Bank Alcalá Pichincha Degroof<br />
1. Intereses y r<strong>en</strong>dimi<strong>en</strong>tos asimi<strong>la</strong>dos …………………………………………………… 12.270 3.995 4.188 5.149 2.533<br />
2. Intereses y cargas asimi<strong>la</strong>das…………………………………………………………… 3.998 37 1.081 1.663 1.106<br />
3. Remuneración <strong>de</strong> capital reembolsable a <strong>la</strong> vista (solo C. <strong>de</strong> crédito) ………… - - - - -<br />
A) MARGEN DE INTERESES………………………………………………………………… 8.272 3.958 3.107 3.486 1.427<br />
4. R<strong>en</strong>dimi<strong>en</strong>to <strong>de</strong> instrum<strong>en</strong>tos <strong>de</strong> capital……………………………………………… 173 - 10 - -<br />
5. Resultado <strong>de</strong> <strong>en</strong>tida<strong>de</strong>s valoradas por el método <strong>de</strong> <strong>la</strong> participación …………… - - - - -<br />
6. Comisiones percibidas …………………………………………………………………… 21.630 272.476 2.150 6.410 5.710<br />
7. Comisiones pagadas ……………………………………………………………………… 2.424 210.239 134 217 1.379<br />
8. Resultado <strong>de</strong> operaciones financieras (neto) ………………………………………… 2.586 82 56 -4.121 1.183<br />
8.1. Cartera <strong>de</strong> negociación ……………………………………………………………… 2.376 82 - - 1.201<br />
8.2. Otros instrum. Financ. a valor razonable con cambios <strong>en</strong> pér. y gan. …………… - - - - -<br />
8.3. Instrum. Financ. no valorados a valor razonable con cambios <strong>en</strong> pér. y gan …… 210 - 56 - -<br />
8.4. Otros ………………………………………………………………………….………… - - - -4.121 -18<br />
9. Difer<strong>en</strong>cias <strong>de</strong> cambio (neto) …………………………………………………………… 863 -111 - - 19<br />
10. Otros productos <strong>de</strong> explotación ……………………………………………………… 2.157 211 5 247 64<br />
10.1. Ingresos <strong>de</strong> contratos <strong>de</strong> seguros y reaseguros emitidos ……………………… - - - - -<br />
10.2. V<strong>en</strong>tas e ingresos por prestación <strong>de</strong> servicios no financieros ………………… 1.177 211 - - -<br />
10.3. Resto <strong>de</strong> productos <strong>de</strong> explotación ………………………………………………… 980 - 5 247 64<br />
11. Otras cargas <strong>de</strong> explotación …………………………………………………………… 647 150 29 110 171<br />
11.1 Gastos <strong>de</strong> contratos <strong>de</strong> seguros y reaseguros …………………………………… - - - - -<br />
11.2. Variación <strong>de</strong> exist<strong>en</strong>cias …………………………………………………………… - 150 - - -<br />
11.3. Resto <strong>de</strong> cargas <strong>de</strong> explotación …………………………………………………… 647 - 29 110 171<br />
B) MARGEN BRUTO ………………………………………………………………………… 32.610 66.226 5.165 5.695 6.853<br />
12. Gastos <strong>de</strong> administración ……………………………………………………………… 33.384 30.417 5.009 8.574 8.344<br />
12.1. Gastos <strong>de</strong> personal ………………………………………………………………… 19.849 17.966 2.919 5.109 5.025<br />
12.2. Otros gastos g<strong>en</strong>erales <strong>de</strong> administración ………………………………………… 13.535 12.451 2.090 3.465 3.319<br />
13. Amortización ………………………………………………………………………….…… 760 3.444 164 257 545<br />
14. Dotaciones a provisiones (neto) ……………………………………………………… 5.391 - -444 83 -6<br />
15. Pérdidas por <strong>de</strong>terioro <strong>de</strong> activos financieros (neto) ……………………………… -565 -7 - - 343<br />
15.1. Inversiones crediticias ……………………………………………………………… -565 -7 - - 343<br />
15.2. O. inst financ. no valorad. a valor razona. con cambios <strong>en</strong> pér. y gan. ………… - - - - -<br />
C) RESULTADO DE LA ACTIVIDAD DE EXPLOTACIÓN ……………………………… -6.360 32.373 436 -3.219 -2.373<br />
16. Pérdidas por <strong>de</strong>terioro <strong>de</strong>l resto <strong>de</strong> activos (neto) ………………………………… - 32 -5 -1.342 -<br />
16.1. Fondo <strong>de</strong> comercio y otro activo intangible ……………………………………… - - - - -<br />
16.2. Otros activos ………………………………………………………………………… - 32 -5 -1.342 -<br />
17. Ganan. (pérd.) <strong>en</strong> <strong>la</strong> baja <strong>de</strong> act. no c<strong>la</strong>s. como no corri<strong>en</strong>. <strong>en</strong> v<strong>en</strong>ta …………. - - - - 1<br />
18. Difer<strong>en</strong>cia negativa <strong>en</strong> combinaciones <strong>de</strong> negocios ……………………………… - - - - -<br />
19. Ganan. (pérd.) <strong>de</strong> act. no corr. <strong>en</strong> v<strong>en</strong>ta no c<strong>la</strong>s. como oper. ininterrumpidas -413 - - 736 -<br />
D) RESULTADO ANTES DE IMPUESTOS ………………………………………………… -6.773 32.341 441 -1.141 -2.372<br />
20. Impuesto sobre b<strong>en</strong>eficios ……………………………………………………………… -2.013 10.337 133 6 -102<br />
21. Dotación obligat. obras y fondos sociales (solo C. <strong>de</strong> Aho. y Coo. <strong>de</strong> Cré.) … - - - - -<br />
E) RESULT. DEL EJERC. PROCED. DE OPERAC. CONTINUADAS ………………… -4.760 22.004 308 -1.147 -2.270<br />
22. Resultado <strong>de</strong> operaciones interrumpidas (neto) …………………………………… - - - - -<br />
F) RESULTADO CONSOLIDADO DEL EJERCICIO ……………………………………… -4.760 22.004 308 -1.147 -2.270<br />
F.1) Resultado atribuido a <strong>la</strong> <strong>en</strong>tidad dominante ……………………………………… -4.760 22.004 308 -1.147 -2.270<br />
F.2) Resultado atribuido a intereses minoritarios ……………………………………… - - - - -