AGREGADO DE LAS CUENTAS DE PÉRDIDAS Y GANANCIAS CONSOLIDADAS DE LOS GRUPOS BANCARIOS ESPAÑOLES(*) Miles <strong>de</strong> euros Dic Dic Variaciones % sobre ATM <strong>2012</strong> 2011 Absolutas En % <strong>2012</strong> 2011 ACTIVOS TOTALES MEDIOS ………………………………………………..…………… 2.427.017.674 2.270.512.420 156.505.254 6,9 100,00 100,00 1. Intereses y r<strong>en</strong>dimi<strong>en</strong>tos asimi<strong>la</strong>dos ………………………………………………… 102.170.941 100.482.641 1.688.300 1,7 4,21 4,43 2. Intereses y cargas asimi<strong>la</strong>das…………………………………………………………… 49.372.580 49.755.894 -383.314 -0,8 2,03 2,19 A) MARGEN DE INTERESES…………………………………………………………… 52.798.360 50.726.748 2.071.612 4,1 2,18 2,23 4. R<strong>en</strong>dimi<strong>en</strong>to <strong>de</strong> instrum<strong>en</strong>tos <strong>de</strong> capital……………………………………………… 865.935 1.050.238 -184.303 -17,5 0,04 0,05 5. Resultado <strong>de</strong> <strong>en</strong>tida<strong>de</strong>s valoradas por el método <strong>de</strong> <strong>la</strong> participación ……….… 855.146 966.478 -111.332 -11,5 0,04 0,04 6. Comisiones percibidas …………………………………………………………………… 21.866.147 21.680.977 185.170 0,9 0,90 0,95 7. Comisiones pagadas ……………………………………………………………………… 4.642.994 4.122.486 520.508 12,6 0,19 0,18 8. Resultado <strong>de</strong> operaciones financieras (neto) ………………………………………… 6.021.116 4.544.045 1.477.071 32,5 0,25 0,20 8.1. Cartera <strong>de</strong> negociación ……………………………………………………………… 2.530.584 3.385.123 -854.539 -25,2 0,10 0,15 8.2. Otros instrum. financ. a valor razonable con cambios <strong>en</strong> pér. y gan. …………… 253.591 2.988 250.603 n.s. 0,01 0,00 8.3. Instrum. financ. no valorados a valor razonable con cambios <strong>en</strong> pér. y gan. …… 3.418.796 1.189.131 2.229.665 187,5 0,14 0,05 8.4. Otros …………………………………………………………………………………… -181.855 -33.198 -148.657 447,8 -0,01 0,00 9. Difer<strong>en</strong>cias <strong>de</strong> cambio (neto) …………………………………………………………… 150.891 60.654 90.237 148,8 0,01 0,00 10. Otros productos <strong>de</strong> explotación ……………………………………………………… 13.336.543 13.568.905 -232.362 -1,7 0,55 0,60 10.1. Ingresos <strong>de</strong> contratos <strong>de</strong> seguros y reaseguros emitidos ……………………… 10.485.233 10.195.366 289.867 2,8 0,43 0,45 10.2. V<strong>en</strong>tas e ingresos por prestación <strong>de</strong> servicios no financieros …………………… 1.405.787 1.163.118 242.669 20,9 0,06 0,05 10.3. Resto <strong>de</strong> productos <strong>de</strong> explotación ………………………………………………… 1.445.524 2.210.420 -764.896 -34,6 0,06 0,10 11. Otras cargas <strong>de</strong> explotación …………………………………………………………… 13.247.615 12.931.182 316.433 2,4 0,55 0,57 11.1 Gastos <strong>de</strong> contratos <strong>de</strong> seguros y reaseguros …………………………………… 8.641.504 8.914.784 -273.280 -3,1 0,36 0,39 11.2. Variación <strong>de</strong> exist<strong>en</strong>cias …………………………………………………………… 745.584 611.221 134.363 22,0 0,03 0,03 11.3. Resto <strong>de</strong> cargas <strong>de</strong> explotación …………………………………………………… 3.860.527 3.405.178 455.349 13,4 0,16 0,15 B) MARGEN BRUTO ……………………………………………………………………… 78.003.532 75.544.374 2.459.158 3,3 3,21 3,33 12. Gastos <strong>de</strong> administración ……………………………………………………………… 33.599.522 32.509.005 1.090.517 3,4 1,38 1,43 12.1. Gastos <strong>de</strong> personal ………………………………………………………………… 19.505.571 19.068.063 437.508 2,3 0,80 0,84 12.2. Otros gastos g<strong>en</strong>erales <strong>de</strong> administración ………………………………………… 14.093.951 13.440.942 653.009 4,9 0,58 0,59 13. Amortización ………………………………………………………………………….… 3.726.557 3.432.206 294.351 8,6 0,15 0,15 14. Dotaciones a provisiones (neto) ……………………………………………………… 2.637.846 3.253.479 -615.633 -18,9 0,11 0,14 15. Pérdidas por <strong>de</strong>terioro <strong>de</strong> activos financieros (neto) ……………………………… 36.608.798 19.695.453 16.913.345 85,9 1,51 0,87 15.1. Inversiones crediticias ……………………………………………………………… 35.946.746 18.637.234 17.309.512 92,9 1,48 0,82 15.2. Otr. inst financ. no valorad. a valor razona. con cambios <strong>en</strong> pér. y gan. ……… 662.054 1.058.220 -396.166 -37,4 0,03 0,05 C) RESULTADO DE LA ACTIVIDAD DE EXPLOTACIÓN …………………………… 1.430.811 16.654.233 -15.223.422 -91,4 0,06 0,73 16. Pérdidas por <strong>de</strong>terioro <strong>de</strong>l resto <strong>de</strong> activos (neto) ………………………………… 3.504.387 4.650.131 -1.145.744 -24,6 0,14 0,20 16.1. Fondo <strong>de</strong> comercio y otro activo intangible ……………………………………… 274.234 2.662.904 -2.388.670 -89,7 0,01 0,12 16.2. Otros activos ………………………………………………………………………… 3.230.153 1.987.227 1.242.926 62,5 0,13 0,09 17. Ganan. (pérd.) <strong>en</strong> <strong>la</strong> baja <strong>de</strong> act. no c<strong>la</strong>s. como no corri<strong>en</strong>. <strong>en</strong> v<strong>en</strong>ta ………… 1.098.381 2.627.960 -1.529.579 -58,2 0,05 0,12 18. Difer<strong>en</strong>cia negativa <strong>en</strong> combinaciones <strong>de</strong> negocios ……………………………… 1.309.761 376 1.309.385 n.s. 0,05 0,00 19. Ganan. (pérdi.) <strong>de</strong> act. no corr. <strong>en</strong> v<strong>en</strong>ta no c<strong>la</strong>s. como oper.ininter. ………… -3.264.359 -3.213.833 -50.526 1,6 -0,13 -0,14 D) RESULTADO ANTES DE IMPUESTOS …………………………………………… -2.929.796 11.418.606 -14.348.402 -125,7 -0,12 0,50 20. Impuesto sobre b<strong>en</strong>eficios …………………………………………………………… -774.162 1.615.516 -2.389.678 -147,9 -0,03 0,07 21. Dotación obligatoria a obras y fondos sociales …………………………………… - - - - - 0,00 E) RESULT. DEL EJERC. PROCED. DE OPERAC. CONTINUADAS …..………… -2.155.632 9.803.091 -11.958.723 -122,0 -0,09 0,43 22. Resultado <strong>de</strong> operaciones interrumpidas (neto) …………………………………… 451.330 -24.912 476.242 n.s. 0,02 0,00 F) RESULTADO CONSOLIDADO DEL EJERCICIO ………………………………… -1.704.300 9.778.180 -11.482.480 -117,4 -0,07 0,43 F.1) Resultado atribuido a <strong>la</strong> <strong>en</strong>tidad dominante …………………………………… -2.825.211 8.275.189 -11.100.400 -134,1 -0,12 0,36 F.2) Resultado atribuido a intereses minoritarios ……………………………………… 1.120.910 1.502.991 -382.081 -25,4 0,05 0,07 (*) Compuesto por el agregado <strong>de</strong> <strong>la</strong>s cu<strong>en</strong>tas <strong>de</strong> pérdidas y ganancias consolidadas <strong>de</strong> los grupos <strong>banca</strong>rios españoles más <strong>la</strong>s cu<strong>en</strong>tas <strong>de</strong> pérdidas y ganancias individuales <strong>de</strong> los bancos españoles que no ti<strong>en</strong><strong>en</strong> grupo.
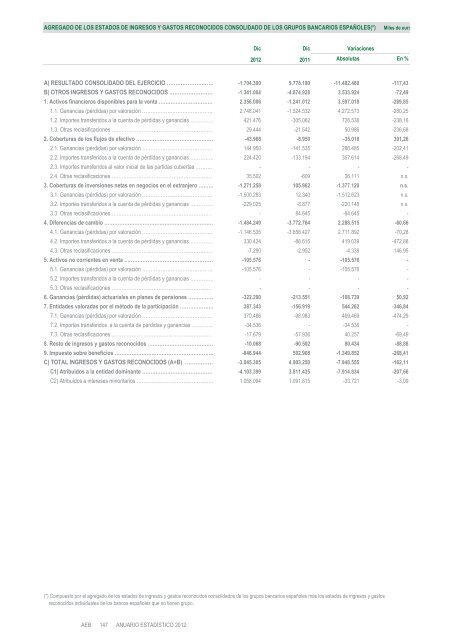
AGREGADO DE LOS ESTADOS DE INGRESOS Y GASTOS RECONOCIDOS CONSOLIDADO DE LOS GRUPOS BANCARIOS ESPAÑOLES(*) Miles <strong>de</strong> euro Dic Dic Variaciones <strong>2012</strong> 2011 Absolutas En % A) RESULTADO CONSOLIDADO DEL EJERCICIO ……………………… -1.704.300 9.778.180 -11.482.480 -117,43 B) OTROS INGRESOS Y GASTOS RECONOCIDOS ……………………… -1.341.004 -4.874.928 3.533.924 -72,49 1. Activos financieros disponibles para <strong>la</strong> v<strong>en</strong>ta …………………………… 2.356.006 -1.241.012 3.597.018 -289,85 1.1. Ganancias (pérdidas) por valoración …………………………………… 2.748.041 -1.524.532 4.272.573 -280,25 1.2. Importes transferidos a <strong>la</strong> cu<strong>en</strong>ta <strong>de</strong> pérdidas y ganancias …………… 421.476 -305.062 726.538 -238,16 1.3. Otras rec<strong>la</strong>sificaciones …………………………………………………… 29.444 -21.542 50.986 -236,68 2. Coberturas <strong>de</strong> los flujos <strong>de</strong> efectivo ………………………………………… -43.968 -8.950 -35.018 391,26 2.1. Ganancias (pérdidas) por valoración …………………………………… 144.950 -141.535 286.485 -202,41 2.2. Importes transferidos a <strong>la</strong> cu<strong>en</strong>ta <strong>de</strong> pérdidas y ganancias …………… 224.420 -133.194 357.614 -268,49 2.3. Importes transferidos al valor inicial <strong>de</strong> <strong>la</strong>s partidas cubiertas ………… - - - - 2.4. Otras rec<strong>la</strong>sificaciones …………………………………………………… 35.502 -609 36.111 n.s. 3. Coberturas <strong>de</strong> inversiones netas <strong>en</strong> negocios <strong>en</strong> el extranjero ……… -1.271.258 105.862 -1.377.120 n.s. 3.1. Ganancias (pérdidas) por valoración …………………………………… -1.500.283 12.340 -1.512.623 n.s. 3.2. Importes transferidos a <strong>la</strong> cu<strong>en</strong>ta <strong>de</strong> pérdidas y ganancias …………… -229.025 -8.877 -220.148 n.s. 3.3. Otras rec<strong>la</strong>sificaciones …………………………………………………… - 84.645 -84.645 - 4. Difer<strong>en</strong>cias <strong>de</strong> cambio ………………………………………………………… -1.484.249 -3.772.764 2.288.515 -60,66 4.1. Ganancias (pérdidas) por valoración …………………………………… -1.146.535 -3.858.427 2.711.892 -70,28 4.2. Importes transferidos a <strong>la</strong> cu<strong>en</strong>ta <strong>de</strong> pérdidas y ganancias …………… 330.424 -88.615 419.039 -472,88 4.3. Otras rec<strong>la</strong>sificaciones …………………………………………………… -7.290 -2.952 -4.338 146,95 5. Activos no corri<strong>en</strong>tes <strong>en</strong> v<strong>en</strong>ta ……………………………………………… -105.576 - -105.576 - 5.1. Ganancias (pérdidas) por valoración …………………………………… -105.576 - -105.576 - 5.2. Importes transferidos a <strong>la</strong> cu<strong>en</strong>ta <strong>de</strong> pérdidas y ganancias …………… - - - - 5.3. Otras rec<strong>la</strong>sificaciones …………………………………………………… - - - - 6. Ganancias (pérdidas) actuariales <strong>en</strong> p<strong>la</strong>nes <strong>de</strong> p<strong>en</strong>siones …………… -322.290 -213.551 -108.739 50,92 7. Entida<strong>de</strong>s valoradas por el método <strong>de</strong> <strong>la</strong> participación ………………… 387.343 -156.919 544.262 -346,84 7.1. Ganancias (pérdidas) por valoración …………………………………… 370.486 -98.983 469.469 -474,29 7.2. Importes transferidos a <strong>la</strong> cu<strong>en</strong>ta <strong>de</strong> pérdidas y ganancias …………… -34.536 - -34.536 - 7.3. Otras rec<strong>la</strong>sificaciones …………………………………………………… -17.679 -57.936 40.257 -69,49 8. Resto <strong>de</strong> ingresos y gastos reconocidos ………………………………… -10.068 -90.502 80.434 -88,88 9. Impuesto sobre b<strong>en</strong>eficios …………………………………………………… -846.944 502.908 -1.349.852 -268,41 C) TOTAL INGRESOS Y GASTOS RECONOCIDOS (A+B) ……………… -3.045.305 4.903.250 -7.948.555 -162,11 C1) Atribuidos a <strong>la</strong> <strong>en</strong>tidad dominante …………………………………… -4.103.399 3.811.435 -7.914.834 -207,66 C2) Atribuidos a intereses minoritarios ………………………………………… 1.058.094 1.091.815 -33.721 -3,09 (*) Compuesto por el agregado <strong>de</strong> los estados <strong>de</strong> ingresos y gastos reconocidos consolidados <strong>de</strong> los grupos <strong>banca</strong>rios españoles más los estados <strong>de</strong> ingresos y gastos reconocidos individuales <strong>de</strong> los bancos españoles que no ti<strong>en</strong><strong>en</strong> grupo.
- Page 1:
Asociación Española de Banca Anua
- Page 4 and 5:
RELACIÓN ALFABÉTICA DE BANCOS Y S
- Page 6 and 7:
RELACIÓN POR CÓDIGO DE BANCOS Y S
- Page 9:
BANCOS CONSEJO DE ADMINISTRACIÓN,
- Page 12 and 13:
BANCO BILBAO VIZCAYA ARGENTARIA Con
- Page 14 and 15:
BANCO POPULAR ESPAÑOL Creado en 19
- Page 16 and 17:
BANKINTER Creado en 1965, con un Ca
- Page 18 and 19:
BARCLAYS BANK Creado en 1946, con u
- Page 20 and 21:
BBVA BANCO DE FINANCIACIÓN Creado
- Page 22 and 23:
BANCA MARCH Creado en 1926, con un
- Page 24 and 25:
BANESTO BANCO DE EMISIONES Creado e
- Page 26 and 27:
BANCO COOPERATIVO ESPAÑOL Creado e
- Page 28 and 29:
SANTANDER INVESTMENT Creado en 1877
- Page 30 and 31:
BANCO CAIXA GERAL Creado en 1969, c
- Page 32 and 33:
TARGOBANK Creado en 1993, con un Ca
- Page 34 and 35:
BANCO DEPOSITARIO BBVA Creado en 19
- Page 36 and 37:
BANCOPOPULAR-E Creado en 2000, con
- Page 38 and 39:
BANCA PUEYO Creado en 1890, con el
- Page 40 and 41:
BANKIA BANCA PRIVADA Creado en 1897
- Page 42 and 43:
BANCO INVERSIS Creado en 2001, con
- Page 44 and 45:
UNO-E BANK Creado en 1930, con un C
- Page 46 and 47:
BANCOFAR Creado en 1965, con un Cap
- Page 48 and 49:
BANCO MEDIOLANUM Creado en 1989, co
- Page 50 and 51:
BANCO DE MADRID Creado en 1930, con
- Page 52 and 53:
RENTA 4 BANCO Creado en 1927, con u
- Page 54 and 55:
BNP PARIBAS ESPAÑA Creado en 1918,
- Page 56 and 57:
ARESBANK Creado en 1975, con un Cap
- Page 58 and 59:
ALLFUNDS BANK Creado en 1927, con u
- Page 60 and 61:
SELF TRADE BANK Establecido en Espa
- Page 62 and 63:
Presidente: Vicepresidente: Conseje
- Page 64 and 65:
PRIVAT BANK DEGROOF Creado en 1990,
- Page 66 and 67:
BANQUE MAROCAINE DU COMMERCE EXTERI
- Page 68 and 69:
BANCO POPULAR PASTOR Establecido en
- Page 70 and 71:
BANCO DE ALBACETE Creado en 1943, c
- Page 73 and 74:
JP MORGAN CHASE BANK NATIONAL ASSOC
- Page 75 and 76:
BANCO DO BRASIL, S.A. Creado en Bra
- Page 77:
SUCURSALES DE ENTIDADES DE CRÉDITO
- Page 80 and 81:
BANCO ESPIRITO SANTO, S.A. Establec
- Page 82 and 83:
DEUTSCHE BANK A.G. Creado en 1870 e
- Page 84 and 85:
SOCIETE GENERALE Creado en 1864 en
- Page 86 and 87:
FORTIS BANK, S.A. Creado en 1934 en
- Page 88 and 89:
CREDIT AGRICOLE LUXEMBOURG Establec
- Page 90 and 91:
SOFINLOC INSTITUIÇAO FINANCEIRA DE
- Page 92 and 93:
UBI BANCA INTERNATIONAL, S.A. Estab
- Page 94 and 95:
CORTAL CONSORS Establecido en Espa
- Page 96 and 97: PICTET & CIE (EUROPE), S.A. Estable
- Page 98 and 99: EUROPE ARAB BANK PLC Establecido en
- Page 100 and 101: HYPOTHEKENBANK FRANKFURT A.G. Estab
- Page 102 and 103: BANK OF SCOTLAND Establecido en Esp
- Page 104 and 105: BNP PARIBAS LEASE GROUP, S.A. Estab
- Page 106 and 107: CREDIT AGRICOLE LEASING & FACTORING
- Page 108 and 109: MCE BANK GMBH Establecido en Españ
- Page 110 and 111: JP MORGAN SECURITES LTD. Establecid
- Page 112 and 113: JP MORGAN INTERNATIONAL BANK LTD. E
- Page 114 and 115: BANCO MAIS S.A. (ESPANHA) Estableci
- Page 116 and 117: OREY FINANCIAL-INSTITUIÇAO FINANCE
- Page 119 and 120: ESTADOS FINANCIEROS CONSOLIDADOS Ba
- Page 121 and 122: BALANCES CONSOLIDADOS DE LA BANCA E
- Page 123 and 124: BALANCES CONSOLIDADOS DE LA BANCA E
- Page 125 and 126: BALANCES CONSOLIDADOS DE LA BANCA E
- Page 127 and 128: BALANCES CONSOLIDADOS DE LA BANCA E
- Page 129 and 130: BALANCES CONSOLIDADOS DE LA BANCA E
- Page 131 and 132: BALANCES CONSOLIDADOS DE LA BANCA E
- Page 133 and 134: BALANCES CONSOLIDADOS DE LA BANCA E
- Page 135 and 136: BALANCES CONSOLIDADOS DE LA BANCA E
- Page 137 and 138: AGREGADO DE LOS BALANCES CONSOLIDAD
- Page 139 and 140: CUENTA DE PÉRDIDAS Y GANANCIAS CON
- Page 141 and 142: CUENTA DE PÉRDIDAS Y GANANCIAS CON
- Page 143 and 144: CUENTA DE PÉRDIDAS Y GANANCIAS CON
- Page 145: CUENTA DE PÉRDIDAS Y GANANCIAS CON
- Page 149: AGREGADO DE LOS ESTADOS TOTALES DE
- Page 152 and 153: BALANCES DE LA BANCA EN ESPAÑA / D
- Page 154 and 155: BALANCES DE LA BANCA EN ESPAÑA / D
- Page 156 and 157: BALANCES DE LA BANCA EN ESPAÑA / D
- Page 158 and 159: BALANCES DE LA BANCA EN ESPAÑA / D
- Page 160 and 161: BALANCES DE LA BANCA EN ESPAÑA / D
- Page 162 and 163: BALANCES DE LA BANCA EN ESPAÑA / D
- Page 164 and 165: BALANCES DE LA BANCA EN ESPAÑA / D
- Page 166 and 167: BALANCES DE LA BANCA EN ESPAÑA / D
- Page 168 and 169: BALANCES DE LA BANCA EN ESPAÑA / D
- Page 170 and 171: BALANCES DE LA BANCA EN ESPAÑA / D
- Page 172 and 173: BALANCES DE LA BANCA EN ESPAÑA / D
- Page 174 and 175: BALANCES DE LA BANCA EN ESPAÑA / D
- Page 176 and 177: BALANCES DE LA BANCA EN ESPAÑA / D
- Page 178 and 179: BALANCES DE LA BANCA EN ESPAÑA / D
- Page 180 and 181: BALANCES DE LA BANCA EN ESPAÑA / D
- Page 182 and 183: AGREGADO DE LOS BALANCES INDIVIDUAL
- Page 184 and 185: CUENTA DE PÉRDIDAS Y GANANCIAS / D
- Page 186 and 187: CUENTA DE PÉRDIDAS Y GANANCIAS / D
- Page 188 and 189: CUENTA DE PÉRDIDAS Y GANANCIAS / D
- Page 190 and 191: CUENTA DE PÉRDIDAS Y GANANCIAS / D
- Page 192 and 193: CUENTA DE PÉRDIDAS Y GANANCIAS / D
- Page 194 and 195: CUENTA DE PÉRDIDAS Y GANANCIAS / D
- Page 196 and 197:
CUENTA DE PÉRDIDAS Y GANANCIAS / D
- Page 198 and 199:
CUENTA DE PÉRDIDAS Y GANANCIAS / D
- Page 200 and 201:
AGREGADO DE LOS ESTADOS DE INGRESOS
- Page 202 and 203:
ESTADOS TOTALES DE CAMBIOS EN EL PA
- Page 204 and 205:
ESTADOS TOTALES DE CAMBIOS EN EL PA
- Page 207 and 208:
INSCRIPCIÓN EN EL REGISTRO DE BANC
- Page 209 and 210:
INSCRIPCIÓN EN EL REGISTRO DE BANC
- Page 211 and 212:
INSCRIPCIÓN EN EL REGISTRO DE BANC
- Page 213 and 214:
CAMBIO DE NOMBRE DE BANCOS EXISTENT
- Page 215 and 216:
ABSORCIONES DE BANCOS (De 1947 a Ma
- Page 217 and 218:
ABSORCIONES DE BANCOS (De 1947 a Ma
- Page 219 and 220:
ABSORCIONES DE BANCOS (De 1947 a Ma
- Page 221 and 222:
GRUPOS Y SUBGRUPOS BANCARIOS CON BA
- Page 223 and 224:
DATOS AGREGADOS A 31-12-2012 EMPLEA
- Page 225 and 226:
EVOLUCIÓN HISTÓRICA DE OFICINAS P
- Page 227 and 228:
EVOLUCIÓN HISTÓRICA DE OFICINAS P
- Page 229 and 230:
EVOLUCIÓN HISTÓRICA DE OFICINAS P
- Page 231:
DATOS PROVINCIALES Y AUTONÓMICOS
- Page 234 and 235:
DISTRIBUCIÓN PROVINCIAL DE OFICINA
- Page 236 and 237:
DISTRIBUCIÓN PROVINCIAL DE OFICINA
- Page 238 and 239:
DISTRIBUCIÓN PROVINCIAL DE OFICINA
- Page 240 and 241:
DISTRIBUCIÓN PROVINCIAL DE OFICINA
- Page 242 and 243:
DISTRIBUCIÓN PROVINCIAL DE OFICINA
- Page 244 and 245:
DISTRIBUCIÓN PROVINCIAL DE OFICINA
- Page 246 and 247:
DISTRIBUCIÓN PROVINCIAL DE OFICINA
- Page 248 and 249:
DISTRIBUCIÓN PROVINCIAL DE OFICINA
- Page 250 and 251:
DISTRIBUCIÓN PROVINCIAL DE OFICINA
- Page 252 and 253:
DISTRIBUCIÓN PROVINCIAL DE OFICINA
- Page 254 and 255:
DISTRIBUCIÓN PROVINCIAL DE OFICINA
- Page 256 and 257:
DISTRIBUCIÓN PROVINCIAL DE OFICINA
- Page 258 and 259:
DISTRIBUCIÓN PROVINCIAL DE OFICINA
- Page 260 and 261:
RELACION PROVINCIAL DE OFICINAS BAN
- Page 262 and 263:
RELACION PROVINCIAL DE OFICINAS BAN
- Page 264 and 265:
RELACION PROVINCIAL DE OFICINAS BAN
- Page 266 and 267:
RELACION PROVINCIAL DE OFICINAS BAN
- Page 268 and 269:
DISTRIBUCIÓN PROVINCIAL DE DEPÓSI
- Page 270 and 271:
MAGNITUDES BANCARIAS. DISTRIBUCION
- Page 273 and 274:
REPRESENTACIONES DE BANCOS ESPAÑOL
- Page 275 and 276:
SUCURSALES DE BANCOS ESPAÑOLES EN
- Page 277 and 278:
BANCOS FILIALES EN EL EXTRANJERO MA
- Page 279 and 280:
REPRESENTACIONES EN ESPAÑA DE ENTI
- Page 281 and 282:
ENTIDADES DE CRÉDITO COMUNITARIAS
- Page 283 and 284:
ENTIDADES DE CRÉDITO COMUNITARIAS
- Page 286:
ASOCIACIÓN ESPAÑOLA DE BANCA Vel