Anuario estadÃstico de la banca en España 2012
Anuario estadÃstico de la banca en España 2012
Anuario estadÃstico de la banca en España 2012

Create successful ePaper yourself
Turn your PDF publications into a flip-book with our unique Google optimized e-Paper software.
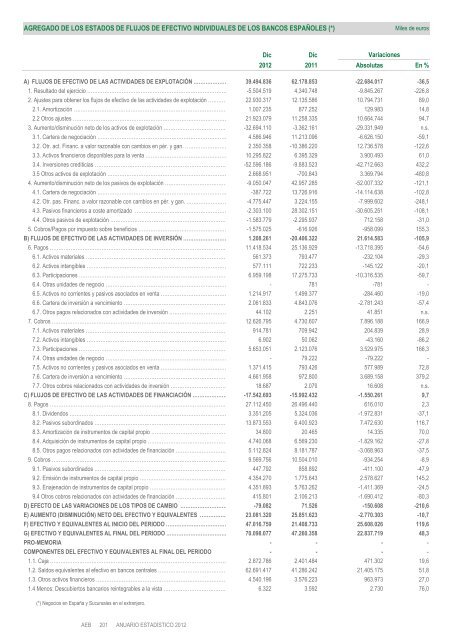
AGREGADO DE LOS ESTADOS DE FLUJOS DE EFECTIVO INDIVIDUALES DE LOS BANCOS ESPAÑOLES (*)<br />
Miles <strong>de</strong> euros<br />
Dic<br />
Dic<br />
Variaciones<br />
<strong>2012</strong> 2011 Absolutas En %<br />
A) FLUJOS DE EFECTIVO DE LAS ACTIVIDADES DE EXPLOTACIÓN ………………… 39.494.836 62.178.853 -22.684.017 -36,5<br />
1. Resultado <strong>de</strong>l ejercicio ……………………………………………………………………… -5.504.519 4.340.748 -9.845.267 -226,8<br />
2. Ajustes para obt<strong>en</strong>er los flujos <strong>de</strong> efectivo <strong>de</strong> <strong>la</strong>s activida<strong>de</strong>s <strong>de</strong> explotación ………… 22.930.317 12.135.586 10.794.731 89,0<br />
2.1. Amortización ……………………………………………………………………………… 1.007.235 877.252 129.983 14,8<br />
2.2 Otros ajustes ……………………………………………………………………………… 21.923.079 11.258.335 10.664.744 94,7<br />
3. Aum<strong>en</strong>to/disminución neto <strong>de</strong> los activos <strong>de</strong> explotación ………………………………… -32.694.110 -3.362.161 -29.331.949 n.s.<br />
3.1. Cartera <strong>de</strong> negociación ………………………………………………………………… 4.586.946 11.213.096 -6.626.150 -59,1<br />
3.2. Otr. act. Financ. a valor razonable con cambios <strong>en</strong> pér. y gan. …………………… 2.350.358 -10.386.220 12.736.578 -122,6<br />
3.3. Activos financieros disponibles para <strong>la</strong> v<strong>en</strong>ta ………………………………………… 10.295.822 6.395.329 3.900.493 61,0<br />
3.4. Inversiones crediticias …………………………………………………………………… -52.596.186 -9.883.523 -42.712.663 432,2<br />
3.5 Otros activos <strong>de</strong> explotación …………………………………………………………… 2.668.951 -700.843 3.369.794 -480,8<br />
4. Aum<strong>en</strong>to/disminución neto <strong>de</strong> los pasivos <strong>de</strong> explotación ……………………………… -9.050.047 42.957.285 -52.007.332 -121,1<br />
4.1. Cartera <strong>de</strong> negociación ………………………………………………………………… -387.722 13.726.916 -14.114.638 -102,8<br />
4.2. Otr. pas. Financ. a valor razonable con cambios <strong>en</strong> pér. y gan. …………………… -4.775.447 3.224.155 -7.999.602 -248,1<br />
4.3. Pasivos financieros a coste amortizado ……………………………………………… -2.303.100 28.302.151 -30.605.251 -108,1<br />
4.4. Otros pasivos <strong>de</strong> explotación …………………………………………………………… -1.583.779 -2.295.937 712.158 -31,0<br />
5. Cobros/Pagos por impuesto sobre b<strong>en</strong>eficios …………………………………………… -1.575.025 -616.926 -958.099 155,3<br />
B) FLUJOS DE EFECTIVO DE LAS ACTIVIDADES DE INVERSIÓN ……………………… 1.208.261 261 -20.406.322 21.614.583 -105,9<br />
6. Pagos …………………………………………………………………………………………… 11.418.534 25.136.929 -13.718.395 -54,6<br />
6.1. Activos materiales ………………………………………………………………………… 561.373 793.477 -232.104 -29,3<br />
6.2. Activos intangibles ……………………………………………………………………… 577.111 722.233 -145.122 -20,1<br />
6.3. Participaciones …………………………………………………………………………… 6.959.198 17.275.733 -10.316.535 -59,7<br />
6.4. Otras unida<strong>de</strong>s <strong>de</strong> negocio ……………………………………………………………… - 781 -781 -<br />
6.5. Activos no corri<strong>en</strong>tes y pasivos asociados <strong>en</strong> v<strong>en</strong>ta ………………………………… 1.214.917 1.499.377 -284.460 -19,0<br />
6.6. Cartera <strong>de</strong> inversión a v<strong>en</strong>cimi<strong>en</strong>to …………………………………………………… 2.061.833 4.843.076 -2.781.243 -57,4<br />
6.7. Otros pagos re<strong>la</strong>cionados con activida<strong>de</strong>s id d <strong>de</strong> inversión ió …………………………… 44.102 2.251251 41.851 n.s.<br />
7. Cobros ………………………………………………………………………………………… 12.626.795 4.730.607 7.896.188 166,9<br />
7.1. Activos materiales ………………………………………………………………………… 914.781 709.942 204.839 28,9<br />
7.2. Activos intangibles ……………………………………………………………………… 6.902 50.062 -43.160 -86,2<br />
7.3. Participaciones …………………………………………………………………………… 5.653.051 2.123.076 3.529.975 166,3<br />
7.4. Otras unida<strong>de</strong>s <strong>de</strong> negocio ……………………………………………………………… - 79.222 -79.222 -<br />
7.5. Activos no corri<strong>en</strong>tes y pasivos asociados <strong>en</strong> v<strong>en</strong>ta ………………………………… 1.371.415 793.426 577.989 72,8<br />
7.6. Cartera <strong>de</strong> inversión a v<strong>en</strong>cimi<strong>en</strong>to …………………………………………………… 4.661.958 972.800 3.689.158 379,2<br />
7.7. Otros cobros re<strong>la</strong>cionados con activida<strong>de</strong>s <strong>de</strong> inversión …………………………… 18.687 2.079 16.608 n.s.<br />
C) FLUJOS DE EFECTIVO DE LAS ACTIVIDADES DE FINANCIACIÓN ………………… -17.542.693 -15.992.432 -1.550.261 9,7<br />
8. Pagos …………………………………………………………………………………………… 27.112.450 26.496.440 616.010 2,3<br />
8.1. Divi<strong>de</strong>ndos ………………………………………………………………………………… 3.351.205 5.324.036 -1.972.831 -37,1<br />
8.2. Pasivos subordinados …………………………………………………………………… 13.873.553 6.400.923 7.472.630 116,7<br />
8.3. Amortización <strong>de</strong> instrum<strong>en</strong>tos <strong>de</strong> capital propio ……………………………………… 34.800 20.465 14.335 70,0<br />
8.4. Adquisición <strong>de</strong> instrum<strong>en</strong>tos <strong>de</strong> capital propio ………………………………………… 4.740.068 6.569.230 -1.829.162 -27,8<br />
8.5. Otros pagos re<strong>la</strong>cionados con activida<strong>de</strong>s <strong>de</strong> financiación ………………………… 5.112.824 8.181.787 -3.068.963 -37,5<br />
9. Cobros ………………………………………………………………………………………… 9.569.756 10.504.010 -934.254 -8,9<br />
9.1. Pasivos subordinados …………………………………………………………………… 447.792 858.892 -411.100 -47,9<br />
9.2. Emisión <strong>de</strong> instrum<strong>en</strong>tos <strong>de</strong> capital propio …………………………………………… 4.354.270 1.775.643 2.578.627 145,2<br />
9.3. Enaj<strong>en</strong>ación <strong>de</strong> instrum<strong>en</strong>tos <strong>de</strong> capital propio ……………………………………… 4.351.893 5.763.262 -1.411.369 -24,5<br />
9.4 Otros cobros re<strong>la</strong>cionados con activida<strong>de</strong>s <strong>de</strong> financiación ………………………… 415.801 2.106.213 -1.690.412 -80,3<br />
D) EFECTO DE LAS VARIACIONES DE LOS TIPOS DE CAMBIO ……………………… -79.082 71.526 -150.608 -210,6<br />
E) AUMENTO (DISMINUCIÓN) NETO DEL EFECTIVO Y EQUIVALENTES ……………… 23.081.320 25.851.623 -2.770.303 -10,7<br />
F) EFECTIVO Y EQUIVALENTES AL INICIO DEL PERIODO ……………………………… 47.016.759 21.408.733 25.608.026 119,6<br />
G) EFECTIVO Y EQUIVALENTES AL FINAL DEL PERIODO ……………………………… 70.098.077 47.260.358 22.837.719 48,3<br />
PRO-MEMORIA - - - -<br />
COMPONENTES DEL EFECTIVO Y EQUIVALENTES AL FINAL DEL PERIODO - - - -<br />
1.1. Caja ………………………………………………………………………………………… 2.872.786 2.401.484 471.302 19,6<br />
1.2. Saldos equival<strong>en</strong>tes al efectivo <strong>en</strong> bancos c<strong>en</strong>trales …………………………………… 62.691.417 41.286.242 21.405.175 51,8<br />
1.3. Otros activos financieros …………………………………………………………………… 4.540.196 3.576.223 963.973 27,0<br />
1.4 M<strong>en</strong>os: Descubiertos <strong>banca</strong>rios reintegrables a <strong>la</strong> vista ……………………………… 6.322 3.592 2.730 76,0<br />
(*) Negocios <strong>en</strong> España y Sucursales <strong>en</strong> el extranjero.