Anuario estadÃstico de la banca en España 2012
Anuario estadÃstico de la banca en España 2012
Anuario estadÃstico de la banca en España 2012

You also want an ePaper? Increase the reach of your titles
YUMPU automatically turns print PDFs into web optimized ePapers that Google loves.
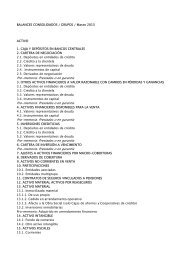
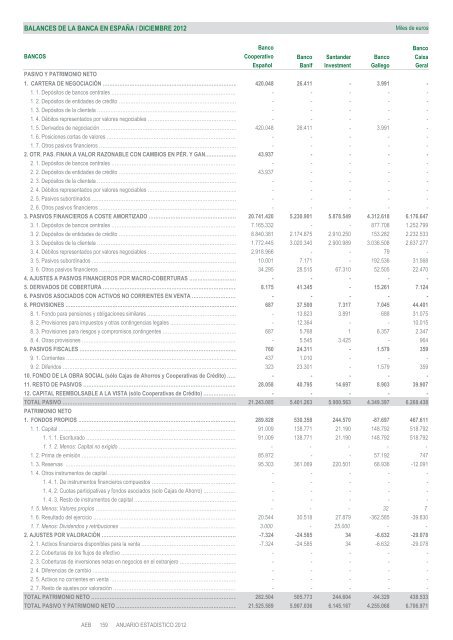
BALANCES DE LA BANCA EN ESPAÑA / DICIEMBRE <strong>2012</strong><br />
Miles <strong>de</strong> euros<br />
Banco<br />
Banco<br />
BANCOS Cooperativo Banco Santan<strong>de</strong>r Banco Caixa<br />
Español Banif Investm<strong>en</strong>t Gallego Geral<br />
PASIVO Y PATRIMONIO NETO<br />
1. CARTERA DE NEGOCIACIÓN ……………………………………………………………………… 420.048 26.411 - 3.991 -<br />
1. 1. Depósitos <strong>de</strong> bancos c<strong>en</strong>trales ………………………………………………………………… - - - - -<br />
1. 2. Depósitos <strong>de</strong> <strong>en</strong>tida<strong>de</strong>s <strong>de</strong> crédito ……………………………………………………………… - - - - -<br />
1. 3. Depósitos <strong>de</strong> <strong>la</strong> cli<strong>en</strong>te<strong>la</strong> ………………………………………………………………………… - - - - -<br />
1. 4. Débitos repres<strong>en</strong>tados por valores negociables ……………………………………………… - - - - -<br />
1. 5. Derivados <strong>de</strong> negociación ……………………………………………………………………… 420.048 26.411 - 3.991 -<br />
1. 6. Posiciones cortas <strong>de</strong> valores …………………………………………………………………… - - - - -<br />
1. 7. Otros pasivos financieros ………………………………………………………………………… - - - - -<br />
2. OTR. PAS. FINAN.A VALOR RAZONABLE CON CAMBIOS EN PÉR. Y GAN.……………… 43.937 - - - -<br />
2. 1. Depósitos <strong>de</strong> bancos c<strong>en</strong>trales ………………………………………………………………… - - - - -<br />
2. 2. Depósitos <strong>de</strong> <strong>en</strong>tida<strong>de</strong>s <strong>de</strong> crédito ……………………………………………………………… 43.937 - - - -<br />
2. 3. Depósitos <strong>de</strong> <strong>la</strong> cli<strong>en</strong>te<strong>la</strong> ………………………………………………………………………… - - - - -<br />
2. 4. Débitos repres<strong>en</strong>tados por valores negociables ……………………………………………… - - - - -<br />
2. 5. Pasivos subordinados …………………………………………………………………………… - - - - -<br />
2. 6. Otros pasivos financieros ………………………………………………………………………… - - - - -<br />
3. PASIVOS FINANCIEROS A COSTE AMORTIZADO ……………………………………………… 20.741.420 5.230.901 5.878.549 4.312.618 6.176.647<br />
3. 1. Depósitos <strong>de</strong> bancos c<strong>en</strong>trales ………………………………………………………………… 7.165.332 - - 877.708 1.252.799<br />
3. 2. Depósitos <strong>de</strong> <strong>en</strong>tida<strong>de</strong>s <strong>de</strong> crédito ……………………………………………………………… 8.840.381 2.174.875 2.910.250 153.282 2.232.533<br />
3. 3. Depósitos <strong>de</strong> <strong>la</strong> cli<strong>en</strong>te<strong>la</strong> ………………………………………………………………………… 1.772.445 3.020.340 2.900.989 3.036.508 2.637.277<br />
3. 4. Débitos repres<strong>en</strong>tados por valores negociables ……………………………………………… 2.918.966 - - 79 -<br />
3. 5. Pasivos subordinados …………………………………………………………………………… 10.001 7.171 - 192.536 31.568<br />
3. 6. Otros pasivos financieros ………………………………………………………………………… 34.295 28.515 67.310 52.505 22.470<br />
4. AJUSTES A PASIVOS FINANCIEROS POR MACRO-COBERTURAS ………………………… - - - - -<br />
5. DERIVADOS DE COBERTURA ……………………………………………………………………… 8.175 41.345 - 15.261 7.124<br />
6. PASIVOS ASOCIADOS CON ACTIVOS NO CORRIENTES EN VENTA ……………………… - - - - -<br />
8. PROVISIONES ……………………………………………………………………………….………… 687 37.500 7.317 7.045 44.401<br />
8. 1. Fondo para p<strong>en</strong>siones y obligaciones simi<strong>la</strong>res ……………………………………………… - 13.823 3.891 688 31.075<br />
8. 2. Provisiones para impuestos y otras conting<strong>en</strong>cias legales ………………………………… - 12.364 - - 10.015<br />
8. 3. Provisiones para riesgos y compromisos conting<strong>en</strong>tes ……………………………………… 687 5.768 1 6.357 2.347<br />
8. 4. Otras provisiones ……………………………………………………………………………….… - 5.545 3.425 - 964<br />
9. PASIVOS FISCALES ……………………………………………………………………………….… 760 24.311 - 1.579 359<br />
9. 1. Corri<strong>en</strong>tes ……………………………………………………………………………….………… 437 1.010 - - -<br />
9. 2. Diferidos ……………………………………………………………………………….…………… 323 23.301 - 1.579 359<br />
10. FONDO DE LA OBRA SOCIAL (sólo Cajas <strong>de</strong> Ahorros y Cooperativas <strong>de</strong> Crédito) …… - - - - -<br />
11. RESTO DE PASIVOS ………………………………………………………………………………. 28.058 40.795 14.697 8.903 39.907<br />
12. CAPITAL REEMBOLSABLE A LA VISTA (sólo Cooperativas <strong>de</strong> Crédito) ………………… - - - - -<br />
TOTAL PASIVO ……………………………………………………………………………….…………… 21.243.085 5.401.263 5.900.563 4.349.397 6.268.438<br />
PATRIMONIO NETO<br />
1. FONDOS PROPIOS ……………………………………………………………………………….… 289.828 530.358 244.570 -87.697 467.611<br />
1. 1. Capital ……………………………………………………………………………….…………… 91.009 138.771 21.190 148.792 518.792<br />
1. 1. 1. Escriturado ……………………………………………………………………………… 91.009 138.771 21.190 148.792 518.792<br />
1. 1. 2. M<strong>en</strong>os: Capital no exigido ……………………………………………………………… - - - - -<br />
1. 2. Prima <strong>de</strong> emisión ……………………………………………………………………………….… 85.972 - - 57.192 747<br />
1. 3. Reservas ……………………………………………………………………………….………… 95.303 361.069 220.501 68.936 -12.091<br />
1. 4. Otros instrum<strong>en</strong>tos <strong>de</strong> capital …………………………………………………………………… - - - - -<br />
1. 4. 1. De instrum<strong>en</strong>tos financieros compuestos …………………………………………… - - - - -<br />
1. 4. 2. Cuotas participativas y fondos asociados (solo Cajas <strong>de</strong> Ahorro) ………………… - - - - -<br />
1. 4. 3. Resto <strong>de</strong> instrum<strong>en</strong>tos <strong>de</strong> capital ……………………………………………………… - - - - -<br />
1. 5. M<strong>en</strong>os: Valores propios ………………………………………………………………………… - - - 32 7<br />
1. 6. Resultado <strong>de</strong>l ejercicio …………………………………………………………………………… 20.544 30.518 27.879 -362.585 -39.830<br />
1. 7. M<strong>en</strong>os: Divi<strong>de</strong>ndos y retribuciones …………………………………………………………… 3.000 - 25.000 - -<br />
2. AJUSTES POR VALORACIÓN ……………………………………………………………………… -7.324 -24.585 34 -6.632 -29.078<br />
2. 1. Activos financieros disponibles para <strong>la</strong> v<strong>en</strong>ta ………………………………………………… -7.324 -24.585 34 -6.632 -29.078<br />
2. 2. Coberturas <strong>de</strong> los flujos <strong>de</strong> efectivo …………………………………………………………… - - - - -<br />
2. 3. Coberturas <strong>de</strong> inversiones netas <strong>en</strong> negocios <strong>en</strong> el extranjero ……………………………… - - - - -<br />
2. 4. Difer<strong>en</strong>cias <strong>de</strong> cambio …………………………………………………………………………… - - - - -<br />
2. 5. Activos no corri<strong>en</strong>tes <strong>en</strong> v<strong>en</strong>ta ………………………………………………………………… - - - - -<br />
2. 7. Resto <strong>de</strong> ajustes por valoración ………………………………………………………………… - - - - -<br />
TOTAL PATRIMONIO NETO …………………………………………………………………………… 282.504 505.773 244.604 -94.329 438.533<br />
TOTAL PASIVO Y PATRIMONIO NETO ……………………………………………………………… 21.525.589 5.907.036 6.145.167 4.255.068 6.706.971