Anuario estadÃstico de la banca en España 2012
Anuario estadÃstico de la banca en España 2012
Anuario estadÃstico de la banca en España 2012

Create successful ePaper yourself
Turn your PDF publications into a flip-book with our unique Google optimized e-Paper software.
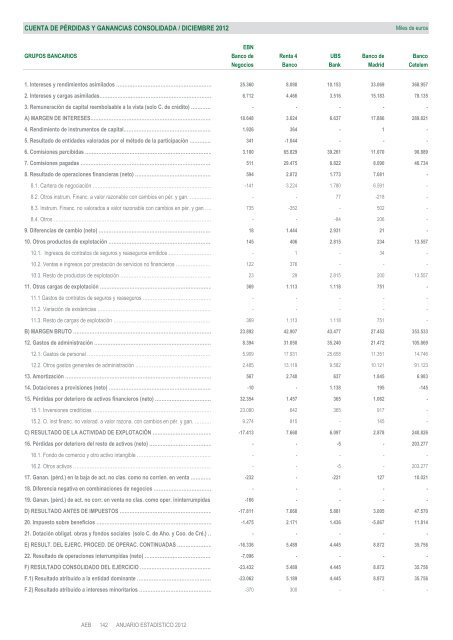
CUENTA DE PÉRDIDAS Y GANANCIAS CONSOLIDADA / DICIEMBRE <strong>2012</strong><br />
Miles <strong>de</strong> euros<br />
EBN<br />
GRUPOS BANCARIOS Banco <strong>de</strong> R<strong>en</strong>ta 4 UBS Banco <strong>de</strong> Banco<br />
Negocios Banco Bank Madrid Cetelem<br />
1. Intereses y r<strong>en</strong>dimi<strong>en</strong>tos asimi<strong>la</strong>dos …………………………………………………… 25.360 8.090 10.153 33.069 368.957<br />
2. Intereses y cargas asimi<strong>la</strong>das…………………………………………………………… 6.712 4.466 3.516 15.183 79.135<br />
3. Remuneración <strong>de</strong> capital reembolsable a <strong>la</strong> vista (solo C. <strong>de</strong> crédito) ………… - - - - -<br />
A) MARGEN DE INTERESES………………………………………………………………… 18.648 3.624 6.637 17.886 289.821<br />
4. R<strong>en</strong>dimi<strong>en</strong>to <strong>de</strong> instrum<strong>en</strong>tos <strong>de</strong> capital……………………………………………… 1.926 364 - 1 -<br />
5. Resultado <strong>de</strong> <strong>en</strong>tida<strong>de</strong>s valoradas por el método <strong>de</strong> <strong>la</strong> participación …………… 341 -1.044 - - -<br />
6. Comisiones percibidas …………………………………………………………………… 3.100 65.829 39.261 11.070 90.889<br />
7. Comisiones pagadas ……………………………………………………………………… 511 29.475 8.822 8.090 40.734<br />
8. Resultado <strong>de</strong> operaciones financieras (neto) ………………………………………… 594 2.872 1.773 7.081 -<br />
8.1. Cartera <strong>de</strong> negociación ……………………………………………………………… -141 3.224 1.780 6.591 -<br />
8.2. Otros instrum. Financ. a valor razonable con cambios <strong>en</strong> pér. y gan. …………… - - 77 -218 -<br />
8.3. Instrum. Financ. no valorados a valor razonable con cambios <strong>en</strong> pér. y gan …… 735 -352 - 502 -<br />
8.4. Otros ………………………………………………………………………….………… - - -84 206 -<br />
9. Difer<strong>en</strong>cias <strong>de</strong> cambio (neto) …………………………………………………………… 18 1.444 2.931 21 -<br />
10. Otros productos <strong>de</strong> explotación ……………………………………………………… 145 406 2.815 234 13.557<br />
10.1. Ingresos <strong>de</strong> contratos <strong>de</strong> seguros y reaseguros emitidos ……………………… - 1 - 34 -<br />
10.2. V<strong>en</strong>tas e ingresos por prestación <strong>de</strong> servicios no financieros ………………… 122 376 - - -<br />
10.3. Resto <strong>de</strong> productos <strong>de</strong> explotación ………………………………………………… 23 29 2.815 200 13.557<br />
11. Otras cargas <strong>de</strong> explotación …………………………………………………………… 369 1.113 1.118 751 -<br />
11.1 Gastos <strong>de</strong> contratos <strong>de</strong> seguros y reaseguros …………………………………… - - - - -<br />
11.2. Variación <strong>de</strong> exist<strong>en</strong>cias …………………………………………………………… - - - - -<br />
11.3. Resto <strong>de</strong> cargas <strong>de</strong> explotación …………………………………………………… 369 1.113 1.118 751 -<br />
B) MARGEN BRUTO ………………………………………………………………………… 23.892 42.907 43.477 27.452 353.533<br />
12. Gastos <strong>de</strong> administración ……………………………………………………………… 8.394 31.050 35.240 21.472 105.869<br />
12.1. Gastos <strong>de</strong> personal ………………………………………………………………… 5.909 17.931 25.658 11.351 14.746<br />
12.2. Otros gastos g<strong>en</strong>erales <strong>de</strong> administración ………………………………………… 2.485 13.119 9.582 10.121 91.123<br />
13. Amortización ………………………………………………………………………….…… 567 2.740 637 1.845 6.983<br />
14. Dotaciones a provisiones (neto) ……………………………………………………… -10 - 1.138 195 -145<br />
15. Pérdidas por <strong>de</strong>terioro <strong>de</strong> activos financieros (neto) ……………………………… 32.354 1.457 365 1.062 -<br />
15.1. Inversiones crediticias ……………………………………………………………… 23.080 642 365 917 -<br />
15.2. O. inst financ. no valorad. a valor razona. con cambios <strong>en</strong> pér. y gan. ………… 9.274 815 - 145 -<br />
C) RESULTADO DE LA ACTIVIDAD DE EXPLOTACIÓN ……………………………… -17.413 7.660 6.097 2.878 240.826<br />
16. Pérdidas por <strong>de</strong>terioro <strong>de</strong>l resto <strong>de</strong> activos (neto) ………………………………… - - -5 - 203.277<br />
16.1. Fondo <strong>de</strong> comercio y otro activo intangible ……………………………………… - - - - -<br />
16.2. Otros activos ………………………………………………………………………… - - -5 - 203.277<br />
17. Ganan. (pérd.) <strong>en</strong> <strong>la</strong> baja <strong>de</strong> act. no c<strong>la</strong>s. como no corri<strong>en</strong>. <strong>en</strong> v<strong>en</strong>ta …………. -232 - -221 127 10.021<br />
18. Difer<strong>en</strong>cia negativa <strong>en</strong> combinaciones <strong>de</strong> negocios ……………………………… - - - - -<br />
19. Ganan. (pérd.) <strong>de</strong> act. no corr. <strong>en</strong> v<strong>en</strong>ta no c<strong>la</strong>s. como oper. ininterrumpidas -166 - - - -<br />
D) RESULTADO ANTES DE IMPUESTOS ………………………………………………… -17.811 7.660 5.881 3.005 47.570<br />
20. Impuesto sobre b<strong>en</strong>eficios ……………………………………………………………… -1.475 2.171 1.436 -5.867 11.814<br />
21. Dotación obligat. obras y fondos sociales (solo C. <strong>de</strong> Aho. y Coo. <strong>de</strong> Cré.) … - - - - -<br />
E) RESULT. DEL EJERC. PROCED. DE OPERAC. CONTINUADAS ………………… -16.336 5.489 4.445 8.872 35.756<br />
22. Resultado <strong>de</strong> operaciones interrumpidas (neto) …………………………………… -7.096 - - - -<br />
F) RESULTADO CONSOLIDADO DEL EJERCICIO ……………………………………… -23.432 5.489 4.445 8.872 35.756<br />
F.1) Resultado atribuido a <strong>la</strong> <strong>en</strong>tidad dominante ……………………………………… -23.062 5.189 4.445 8.872 35.756<br />
F.2) Resultado atribuido a intereses minoritarios ……………………………………… -370 300 - - -