Anuario estadÃstico de la banca en España 2012
Anuario estadÃstico de la banca en España 2012
Anuario estadÃstico de la banca en España 2012

Create successful ePaper yourself
Turn your PDF publications into a flip-book with our unique Google optimized e-Paper software.
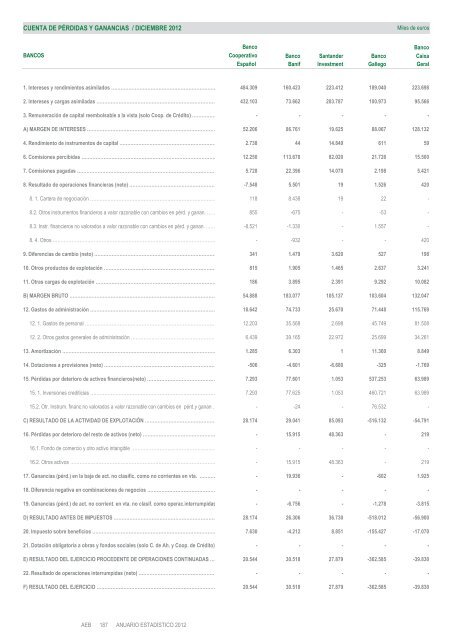
CUENTA DE PÉRDIDAS Y GANANCIAS / DICIEMBRE <strong>2012</strong><br />
Miles <strong>de</strong> euros<br />
Banco<br />
Banco<br />
BANCOS Cooperativo Banco Santan<strong>de</strong>r Banco Caixa<br />
Español Banif Investm<strong>en</strong>t Gallego Geral<br />
1. Intereses y r<strong>en</strong>dimi<strong>en</strong>tos asimi<strong>la</strong>dos ………………………………………………………… 484.309 160.423 223.412 189.040 223.698<br />
2. Intereses y cargas asimi<strong>la</strong>das ………………………………………………………………… 432.103 73.662 203.787 100.973 95.566<br />
3. Remuneración <strong>de</strong> capital reembolsable a <strong>la</strong> vista (solo Coop. <strong>de</strong> Crédito) …………… - - - - -<br />
A) MARGEN DE INTERESES ……………………………………………………………………… 52.206 86.761 19.625 88.067 128.132<br />
4. R<strong>en</strong>dimi<strong>en</strong>to <strong>de</strong> instrum<strong>en</strong>tos <strong>de</strong> capital ……………………………………………………… 2.738 44 14.849 611 59<br />
6. Comisiones percibidas …………………………………………………………………………… 12.250 113.678 82.020 21.726 15.500<br />
7. Comisiones pagadas ……………………………………………………………………………… 5.728 22.396 14.070 2.198 5.421<br />
8. Resultado <strong>de</strong> operaciones financieras (neto) ………………………………………………… -7.548 5.501 19 1.526 420<br />
8. 1. Cartera <strong>de</strong> negociación ……………………………………………………………………… 118 8.438 19 22 -<br />
8.2. Otros instrum<strong>en</strong>tos financieros a valor razonable con cambios <strong>en</strong> pérd. y ganan. …… 855 -675 - -53 -<br />
8.3. Instr. financieros no valorados a valor razonable con cambios <strong>en</strong> pérd. y ganan. .…… -8.521 -1.330 - 1.557 -<br />
8. 4. Otros …………………………………………………………………………………………… - -932 - - 420<br />
9. Difer<strong>en</strong>cias <strong>de</strong> cambio (neto) …………………………………………………………………… 341 1.479 3.620 527 198<br />
10. Otros productos <strong>de</strong> explotación ……………………………………………………………… 815 1.905 1.465 2.637 3.241<br />
11. Otras cargas <strong>de</strong> explotación …………………………………………………………………… 186 3.895 2.391 9.292 10.082<br />
B) MARGEN BRUTO ………………………………………………………………………………… 54.888 183.077 105.137 103.604 132.047<br />
12. Gastos <strong>de</strong> administración ……………………………………………………………………… 18.642 74.733 25.670 71.448 115.769<br />
12. 1. Gastos <strong>de</strong> personal ………………………………………………………………………… 12.203 35.568 2.698 45.749 81.508<br />
12. 2. Otros gastos g<strong>en</strong>erales <strong>de</strong> administración ……………………………………………… 6.439 39.165 22.972 25.699 34.261<br />
13. Amortización ……………………………………………………………………………………… 1.285 6.303 1 11.360 8.849<br />
14. Dotaciones a provisiones (neto) ……………………………………………………………… -506 -4.601 -6.680 -325 -1.769<br />
15. Pérdidas por <strong>de</strong>terioro <strong>de</strong> activos financieros(neto) ……………………………………… 7.293 77.601 1.053 537.253 63.989<br />
15. 1. Inversiones crediticias ……………………………………………………………………… 7.293 77.625 1.053 460.721 63.989<br />
15.2. Otr. Instrum. financ.no valorados a valor razonable con cambios <strong>en</strong> pérd.y ganan … - -24 - 76.532 -<br />
C) RESULTADO DE LA ACTIVIDAD DE EXPLOTACIÓN ……………………………………… 28.174 29.041 85.093 -516.132 -54.791<br />
16. Pérdidas por <strong>de</strong>terioro <strong>de</strong>l resto <strong>de</strong> activos (neto) ………………………………………… - 15.915 48.363 - 219<br />
16.1. Fondo <strong>de</strong> comercio y otro activo intangible ……………………………………………… - - - - -<br />
16.2. Otros activos ………………………………………………………………………………… - 15.915 48.363 - 219<br />
17. Ganancias (pérd.) <strong>en</strong> <strong>la</strong> baja <strong>de</strong> act. no c<strong>la</strong>sific. como no corri<strong>en</strong>tes <strong>en</strong> vta. ………… - 19.936 - -602 1.925<br />
18. Difer<strong>en</strong>cia negativa <strong>en</strong> combinaciones <strong>de</strong> negocios ……………………………………… - - - - -<br />
19. Ganancias (pérd.) <strong>de</strong> act. no corri<strong>en</strong>t. <strong>en</strong> vta. no c<strong>la</strong>sif. como operac.interrumpidas - -6.756 - -1.278 -3.815<br />
D) RESULTADO ANTES DE IMPUESTOS ………………………………………………………… 28.174 26.306 36.730 -518.012 -56.900<br />
20. Impuesto sobre b<strong>en</strong>eficios …………………………………………………………………… 7.630 -4.212 8.851 -155.427 -17.070<br />
21. Dotación obligatoria a obras y fondos sociales (solo C. <strong>de</strong> Ah. y Coop. <strong>de</strong> Crédito) - - - - -<br />
E) RESULTADO DEL EJERCICIO PROCEDENTE DE OPERACIONES CONTINUADAS …… 20.544 30.518 27.879 -362.585 -39.830<br />
22. Resultado <strong>de</strong> operaciones interrumpidas (neto) …………………………………………… - - - - -<br />
F) RESULTADO DEL EJERCICIO ………………………………………………………………… 20.544 30.518 27.879 -362.585 -39.830