Anuario estadÃstico de la banca en España 2012
Anuario estadÃstico de la banca en España 2012
Anuario estadÃstico de la banca en España 2012

Create successful ePaper yourself
Turn your PDF publications into a flip-book with our unique Google optimized e-Paper software.
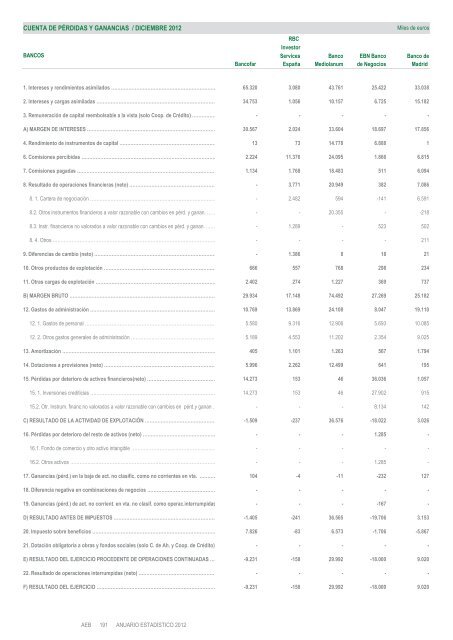
CUENTA DE PÉRDIDAS Y GANANCIAS / DICIEMBRE <strong>2012</strong><br />
Miles <strong>de</strong> euros<br />
RBC<br />
Investor<br />
BANCOS Services Banco EBN Banco Banco <strong>de</strong><br />
Bancofar España Medio<strong>la</strong>num <strong>de</strong> Negocios Madrid<br />
1. Intereses y r<strong>en</strong>dimi<strong>en</strong>tos asimi<strong>la</strong>dos ………………………………………………………… 65.320 3.080 43.761 25.422 33.038<br />
2. Intereses y cargas asimi<strong>la</strong>das ………………………………………………………………… 34.753 1.056 10.157 6.725 15.182<br />
3. Remuneración <strong>de</strong> capital reembolsable a <strong>la</strong> vista (solo Coop. <strong>de</strong> Crédito) …………… - - - - -<br />
A) MARGEN DE INTERESES ……………………………………………………………………… 30.567 2.024 33.604 18.697 17.856<br />
4. R<strong>en</strong>dimi<strong>en</strong>to <strong>de</strong> instrum<strong>en</strong>tos <strong>de</strong> capital ……………………………………………………… 13 73 14.778 6.888 1<br />
6. Comisiones percibidas …………………………………………………………………………… 2.224 11.376 24.095 1.866 6.815<br />
7. Comisiones pagadas ……………………………………………………………………………… 1.134 1.768 18.483 511 6.094<br />
8. Resultado <strong>de</strong> operaciones financieras (neto) ………………………………………………… - 3.771 20.949 382 7.086<br />
8. 1. Cartera <strong>de</strong> negociación ……………………………………………………………………… - 2.482 594 -141 6.591<br />
8.2. Otros instrum<strong>en</strong>tos financieros a valor razonable con cambios <strong>en</strong> pérd. y ganan. …… - - 20.355 - -218<br />
8.3. Instr. financieros no valorados a valor razonable con cambios <strong>en</strong> pérd. y ganan. .…… - 1.289 - 523 502<br />
8. 4. Otros …………………………………………………………………………………………… - - - - 211<br />
9. Difer<strong>en</strong>cias <strong>de</strong> cambio (neto) …………………………………………………………………… - 1.386 8 18 21<br />
10. Otros productos <strong>de</strong> explotación ……………………………………………………………… 666 557 768 298 234<br />
11. Otras cargas <strong>de</strong> explotación …………………………………………………………………… 2.402 274 1.227 369 737<br />
B) MARGEN BRUTO ………………………………………………………………………………… 29.934 17.148 74.492 27.269 25.182<br />
12. Gastos <strong>de</strong> administración ……………………………………………………………………… 10.769 13.869 24.108 8.047 19.110<br />
12. 1. Gastos <strong>de</strong> personal ………………………………………………………………………… 5.580 9.316 12.906 5.693 10.085<br />
12. 2. Otros gastos g<strong>en</strong>erales <strong>de</strong> administración ……………………………………………… 5.189 4.553 11.202 2.354 9.025<br />
13. Amortización ……………………………………………………………………………………… 405 1.101 1.263 567 1.794<br />
14. Dotaciones a provisiones (neto) ……………………………………………………………… 5.996 2.262 12.499 641 195<br />
15. Pérdidas por <strong>de</strong>terioro <strong>de</strong> activos financieros(neto) ……………………………………… 14.273 153 46 36.036 1.057<br />
15. 1. Inversiones crediticias ……………………………………………………………………… 14.273 153 46 27.902 915<br />
15.2. Otr. Instrum. financ.no valorados a valor razonable con cambios <strong>en</strong> pérd.y ganan … - - - 8.134 142<br />
C) RESULTADO DE LA ACTIVIDAD DE EXPLOTACIÓN ……………………………………… -1.509 -237 36.576 -18.022 3.026<br />
16. Pérdidas por <strong>de</strong>terioro <strong>de</strong>l resto <strong>de</strong> activos (neto) ………………………………………… - - - 1.285 -<br />
16.1. Fondo <strong>de</strong> comercio y otro activo intangible ……………………………………………… - - - - -<br />
16.2. Otros activos ………………………………………………………………………………… - - - 1.285 -<br />
17. Ganancias (pérd.) <strong>en</strong> <strong>la</strong> baja <strong>de</strong> act. no c<strong>la</strong>sific. como no corri<strong>en</strong>tes <strong>en</strong> vta. ………… 104 -4 -11 -232 127<br />
18. Difer<strong>en</strong>cia negativa <strong>en</strong> combinaciones <strong>de</strong> negocios ……………………………………… - - - - -<br />
19. Ganancias (pérd.) <strong>de</strong> act. no corri<strong>en</strong>t. <strong>en</strong> vta. no c<strong>la</strong>sif. como operac.interrumpidas - - - -167 -<br />
D) RESULTADO ANTES DE IMPUESTOS ………………………………………………………… -1.405 -241 36.565 -19.706 3.153<br />
20. Impuesto sobre b<strong>en</strong>eficios …………………………………………………………………… 7.826 -83 6.573 -1.706 -5.867<br />
21. Dotación obligatoria a obras y fondos sociales (solo C. <strong>de</strong> Ah. y Coop. <strong>de</strong> Crédito) - - - - -<br />
E) RESULTADO DEL EJERCICIO PROCEDENTE DE OPERACIONES CONTINUADAS …… -9.231 -158 29.992 -18.000 9.020<br />
22. Resultado <strong>de</strong> operaciones interrumpidas (neto) …………………………………………… - - - - -<br />
F) RESULTADO DEL EJERCICIO ………………………………………………………………… -9.231 -158 29.992 -18.000 9.020