Anuario estadÃstico de la banca en España 2012
Anuario estadÃstico de la banca en España 2012
Anuario estadÃstico de la banca en España 2012
You also want an ePaper? Increase the reach of your titles
YUMPU automatically turns print PDFs into web optimized ePapers that Google loves.
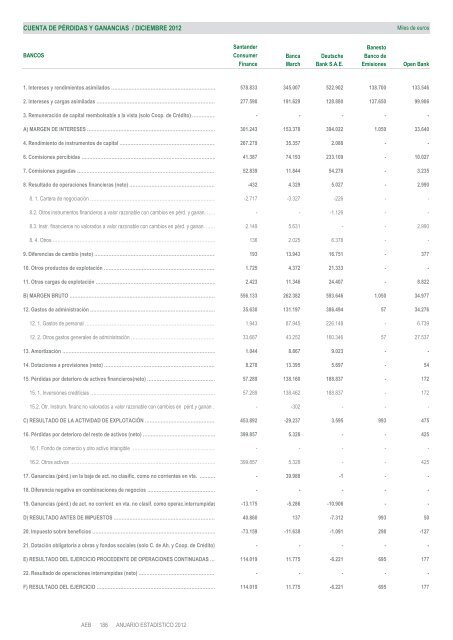
CUENTA DE PÉRDIDAS Y GANANCIAS / DICIEMBRE <strong>2012</strong><br />
Miles <strong>de</strong> euros<br />
Santan<strong>de</strong>r<br />
Banesto<br />
BANCOS Consumer Banca Deutsche Banco <strong>de</strong><br />
Finance March Bank S.A.E. Emisiones Op<strong>en</strong> Bank<br />
1. Intereses y r<strong>en</strong>dimi<strong>en</strong>tos asimi<strong>la</strong>dos ………………………………………………………… 578.833 345.007 522.902 138.700 133.546<br />
2. Intereses y cargas asimi<strong>la</strong>das ………………………………………………………………… 277.590 191.629 128.880 137.650 99.906<br />
3. Remuneración <strong>de</strong> capital reembolsable a <strong>la</strong> vista (solo Coop. <strong>de</strong> Crédito) …………… - - - - -<br />
A) MARGEN DE INTERESES ……………………………………………………………………… 301.243 153.378 394.022 1.050 33.640<br />
4. R<strong>en</strong>dimi<strong>en</strong>to <strong>de</strong> instrum<strong>en</strong>tos <strong>de</strong> capital ……………………………………………………… 267.279 35.357 2.088 - -<br />
6. Comisiones percibidas …………………………………………………………………………… 41.387 74.193 233.109 - 10.027<br />
7. Comisiones pagadas ……………………………………………………………………………… 52.839 11.844 54.276 - 3.235<br />
8. Resultado <strong>de</strong> operaciones financieras (neto) ………………………………………………… -432 4.329 5.027 - 2.990<br />
8. 1. Cartera <strong>de</strong> negociación ……………………………………………………………………… -2.717 -3.327 -226 - -<br />
8.2. Otros instrum<strong>en</strong>tos financieros a valor razonable con cambios <strong>en</strong> pérd. y ganan. …… - - -1.126 - -<br />
8.3. Instr. financieros no valorados a valor razonable con cambios <strong>en</strong> pérd. y ganan. .…… 2.149 5.631 - - 2.990<br />
8. 4. Otros …………………………………………………………………………………………… 136 2.025 6.378 - -<br />
9. Difer<strong>en</strong>cias <strong>de</strong> cambio (neto) …………………………………………………………………… 193 13.943 16.751 - 377<br />
10. Otros productos <strong>de</strong> explotación ……………………………………………………………… 1.725 4.372 21.333 - -<br />
11. Otras cargas <strong>de</strong> explotación …………………………………………………………………… 2.423 11.346 24.407 - 8.822<br />
B) MARGEN BRUTO ………………………………………………………………………………… 556.133 262.382 593.646 1.050 34.977<br />
12. Gastos <strong>de</strong> administración ……………………………………………………………………… 35.630 131.197 386.494 57 34.276<br />
12. 1. Gastos <strong>de</strong> personal ………………………………………………………………………… 1.943 87.945 226.148 - 6.739<br />
12. 2. Otros gastos g<strong>en</strong>erales <strong>de</strong> administración ……………………………………………… 33.687 43.252 160.346 57 27.537<br />
13. Amortización ……………………………………………………………………………………… 1.044 8.867 9.023 - -<br />
14. Dotaciones a provisiones (neto) ……………………………………………………………… 8.278 13.395 5.697 - 54<br />
15. Pérdidas por <strong>de</strong>terioro <strong>de</strong> activos financieros(neto) ……………………………………… 57.289 138.160 188.837 - 172<br />
15. 1. Inversiones crediticias ……………………………………………………………………… 57.289 138.462 188.837 - 172<br />
15.2. Otr. Instrum. financ.no valorados a valor razonable con cambios <strong>en</strong> pérd.y ganan … - -302 - - -<br />
C) RESULTADO DE LA ACTIVIDAD DE EXPLOTACIÓN ……………………………………… 453.892 -29.237 3.595 993 475<br />
16. Pérdidas por <strong>de</strong>terioro <strong>de</strong>l resto <strong>de</strong> activos (neto) ………………………………………… 399.857 5.328 - - 425<br />
16.1. Fondo <strong>de</strong> comercio y otro activo intangible ……………………………………………… - - - - -<br />
16.2. Otros activos ………………………………………………………………………………… 399.857 5.328 - - 425<br />
17. Ganancias (pérd.) <strong>en</strong> <strong>la</strong> baja <strong>de</strong> act. no c<strong>la</strong>sific. como no corri<strong>en</strong>tes <strong>en</strong> vta. ………… - 39.988 -1 - -<br />
18. Difer<strong>en</strong>cia negativa <strong>en</strong> combinaciones <strong>de</strong> negocios ……………………………………… - - - - -<br />
19. Ganancias (pérd.) <strong>de</strong> act. no corri<strong>en</strong>t. <strong>en</strong> vta. no c<strong>la</strong>sif. como operac.interrumpidas -13.175 -5.286 -10.906 - -<br />
D) RESULTADO ANTES DE IMPUESTOS ………………………………………………………… 40.860 137 -7.312 993 50<br />
20. Impuesto sobre b<strong>en</strong>eficios …………………………………………………………………… -73.159 -11.638 -1.091 298 -127<br />
21. Dotación obligatoria a obras y fondos sociales (solo C. <strong>de</strong> Ah. y Coop. <strong>de</strong> Crédito) - - - - -<br />
E) RESULTADO DEL EJERCICIO PROCEDENTE DE OPERACIONES CONTINUADAS …… 114.019 11.775 -6.221 695 177<br />
22. Resultado <strong>de</strong> operaciones interrumpidas (neto) …………………………………………… - - - - -<br />
F) RESULTADO DEL EJERCICIO ………………………………………………………………… 114.019 11.775 -6.221 695 177


