Proyector RD - Ministerio de Medio Ambiente
Proyector RD - Ministerio de Medio Ambiente
Proyector RD - Ministerio de Medio Ambiente
- No tags were found...

Create successful ePaper yourself
Turn your PDF publications into a flip-book with our unique Google optimized e-Paper software.
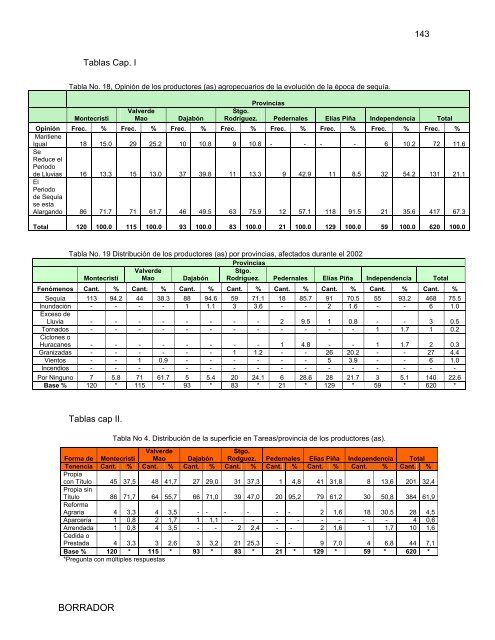
143Tablas Cap. ITabla No. 18, Opinión <strong>de</strong> los productores (as) agropecuarios <strong>de</strong> la evolución <strong>de</strong> la época <strong>de</strong> sequía.MontecristiValver<strong>de</strong>MaoDajabónProvinciasStgo.Rodríguez. Pe<strong>de</strong>rnales Elías Piña In<strong>de</strong>pen<strong>de</strong>ncia TotalOpinión Frec. % Frec. % Frec. % Frec. % Frec. % Frec. % Frec. % Frec. %MantieneIgual 18 15.0 29 25.2 10 10.8 9 10.8 - - - - 6 10.2 72 11.6SeReduce elPeriodo<strong>de</strong> Lluvias 16 13.3 15 13.0 37 39.8 11 13.3 9 42.9 11 8.5 32 54.2 131 21.1ElPeriodo<strong>de</strong> Sequíase estaAlargando 86 71.7 71 61.7 46 49.5 63 75.9 12 57.1 118 91.5 21 35.6 417 67.3Total 120 100.0 115 100.0 93 100.0 83 100.0 21 100.0 129 100.0 59 100.0 620 100.0Tabla No. 19 Distribución <strong>de</strong> los productores (as) por provincias, afectados durante el 2002ProvinciasMontecristiValver<strong>de</strong>Mao DajabónStgo.Rodríguez. Pe<strong>de</strong>rnales Elías Piña In<strong>de</strong>pen<strong>de</strong>ncia TotalFenómenos Cant. % Cant. % Cant. % Cant. % Cant. % Cant. % Cant. % Cant. %Sequía 113 94.2 44 38.3 88 94.6 59 71.1 18 85.7 91 70.5 55 93.2 468 75.5Inundación - - - - 1 1.1 3 3.6 - - 2 1.6 - - 6 1.0Exceso <strong>de</strong>Lluvia - - - - - - - - 2 9.5 1 0.8 - - 3 0.5Tornados - - - - - - - - - - - - 1 1.7 1 0.2Ciclones oHuracanes - - - - - - - - 1 4.8 - - 1 1.7 2 0.3Granizadas - - - - - - 1 1.2 - - 26 20.2 - - 27 4.4Vientos - - 1 0.9 - - - - - - 5 3.9 - - 6 1.0Incendios - - - - - - - - - - - - - - - -Por Ninguno 7 5.8 71 61.7 5 5.4 20 24.1 6 28.6 28 21.7 3 5.1 140 22.6Base % 120 * 115 * 93 * 83 * 21 * 129 * 59 * 620 *Tablas cap II.Tabla No 4. Distribución <strong>de</strong> la superficie en Tareas/provincia <strong>de</strong> los productores (as).Forma <strong>de</strong> MontecristiValver<strong>de</strong>Mao DajabónStgo.Rodguez. Pe<strong>de</strong>rnales Elias Piña In<strong>de</strong>pen<strong>de</strong>ncia TotalTenencia Cant. % Cant. % Cant. % Cant. % Cant. % Cant. % Cant. % Cant. %Propiacon Título 45 37,5 48 41,7 27 29,0 31 37,3 1 4,8 41 31,8 8 13,6 201 32,4Propia sinTítulo 86 71,7 64 55,7 66 71,0 39 47,0 20 95,2 79 61,2 30 50,8 384 61,9ReformaAgraria 4 3,3 4 3,5 - - - - - - 2 1,6 18 30,5 28 4,5Aparcería 1 0,8 2 1,7 1 1,1 - - - - - - - - 4 0,6Arrendada 1 0,8 4 3,5 - - 2 2,4 - - 2 1,6 1 1,7 10 1,6Cedida oPrestada 4 3,3 3 2,6 3 3,2 21 25,3 - - 9 7,0 4 6,8 44 7,1Base % 120 * 115 * 93 * 83 * 21 * 129 * 59 * 620 **Pregunta con múltiples respuestasBORRADOR

![Documento de trabajo del grupo G-77[1] EconomÃa verde en el ...](https://img.yumpu.com/50859069/1/190x245/documento-de-trabajo-del-grupo-g-771-economa-a-verde-en-el-.jpg?quality=85)