Proyector RD - Ministerio de Medio Ambiente
Proyector RD - Ministerio de Medio Ambiente
Proyector RD - Ministerio de Medio Ambiente
- No tags were found...

Create successful ePaper yourself
Turn your PDF publications into a flip-book with our unique Google optimized e-Paper software.
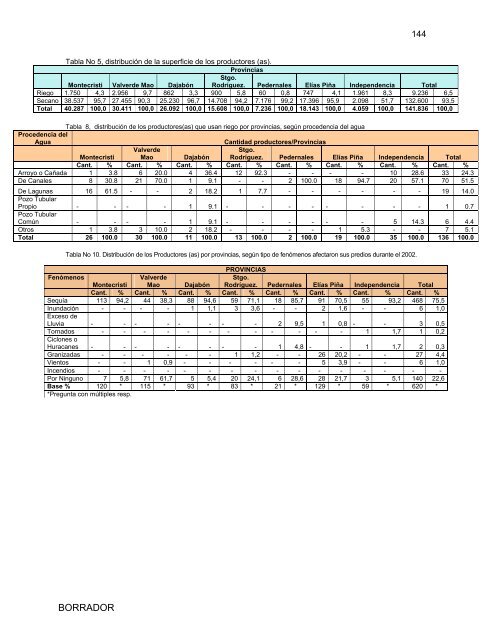
144Tabla No 5, distribución <strong>de</strong> la superficie <strong>de</strong> los productores (as).ProvinciasStgo.Montecristi Valver<strong>de</strong> Mao Dajabón Rodríguez. Pe<strong>de</strong>rnales Elías Piña In<strong>de</strong>pen<strong>de</strong>ncia TotalRiego 1.750 4,3 2.956 9,7 862 3,3 900 5,8 60 0,8 747 4,1 1.961 8,3 9.236 6,5Secano 38.537 95,7 27.455 90,3 25.230 96,7 14.708 94,2 7.176 99,2 17.396 95,9 2.098 51,7 132.600 93,5Total 40.287 100,0 30.411 100,0 26.092 100,0 15.608 100,0 7.236 100,0 18.143 100,0 4.059 100,0 141.836 100,0Tabla 8, distribución <strong>de</strong> los productores(as) que usan riego por provincias, según proce<strong>de</strong>ncia <strong>de</strong>l aguaProce<strong>de</strong>ncia <strong>de</strong>lAguaCantidad productores/ProvinciasMontecristiValver<strong>de</strong>Mao DajabónStgo.Rodríguez. Pe<strong>de</strong>rnales Elías Piña In<strong>de</strong>pen<strong>de</strong>ncia TotalCant. % Cant. % Cant. % Cant. % Cant. % Cant. % Cant. % Cant. %Arroyo o Cañada 1 3.8 6 20.0 4 36.4 12 92.3 - - - - 10 28.6 33 24.3De Canales 8 30.8 21 70.0 1 9.1 - - 2 100.0 18 94.7 20 57.1 70 51.5De Lagunas 16 61.5 - - 2 18.2 1 7.7 - - - - - - 19 14.0Pozo TubularPropio - - - - 1 9.1 - - - - - - - - 1 0.7Pozo TubularComún - - - - 1 9.1 - - - - - - 5 14.3 6 4.4Otros 1 3.8 3 10.0 2 18.2 - - - - 1 5.3 - - 7 5.1Total 26 100.0 30 100.0 11 100.0 13 100.0 2 100.0 19 100.0 35 100.0 136 100.0Tabla No 10. Distribución <strong>de</strong> los Productores (as) por provincias, según tipo <strong>de</strong> fenómenos afectaron sus predios durante el 2002.PROVINCIASFenómenosValver<strong>de</strong>Stgo.Montecristi Mao Dajabón Rodríguez. Pe<strong>de</strong>rnales Elías Piña In<strong>de</strong>pen<strong>de</strong>ncia TotalCant. % Cant. % Cant. % Cant. % Cant. % Cant. % Cant. % Cant. %Sequía 113 94,2 44 38,3 88 94,6 59 71,1 18 85,7 91 70,5 55 93,2 468 75,5Inundación - - - - 1 1,1 3 3,6 - - 2 1,6 - - 6 1,0Exceso <strong>de</strong>Lluvia - - - - - - - - 2 9,5 1 0,8 - - 3 0,5Tornados - - - - - - - - - - - - 1 1,7 1 0,2Ciclones oHuracanes - - - - - - - - 1 4,8 - - 1 1,7 2 0,3Granizadas - - - - - - 1 1,2 - - 26 20,2 - - 27 4,4Vientos - - 1 0,9 - - - - - - 5 3,9 - - 6 1,0Incendios - - - - - - - - - - - - - - - -Por Ninguno 7 5,8 71 61,7 5 5,4 20 24,1 6 28,6 28 21,7 3 5,1 140 22,6Base % 120 * 115 * 93 * 83 * 21 * 129 * 59 * 620 **Pregunta con múltiples resp.BORRADOR

![Documento de trabajo del grupo G-77[1] EconomÃa verde en el ...](https://img.yumpu.com/50859069/1/190x245/documento-de-trabajo-del-grupo-g-771-economa-a-verde-en-el-.jpg?quality=85)