dominio - Red por los derechos de la infancia
dominio - Red por los derechos de la infancia
dominio - Red por los derechos de la infancia

You also want an ePaper? Increase the reach of your titles
YUMPU automatically turns print PDFs into web optimized ePapers that Google loves.
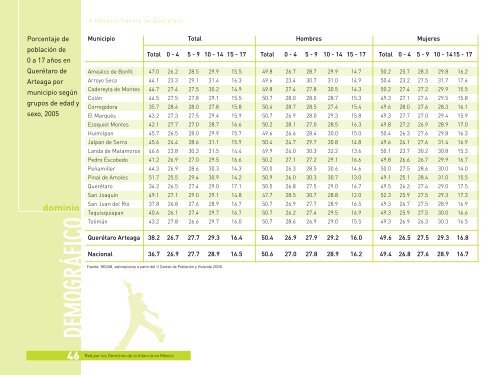
La Infancia Cuenta en QuerétaroPorcentaje <strong>de</strong>pob<strong>la</strong>ción <strong>de</strong>0 a 17 años enQuerétaro <strong>de</strong>Arteaga <strong>por</strong>municipio segúngrupos <strong>de</strong> edad ysexo, 2005<strong>dominio</strong>DEMOGRÁFICO46Municipio Total Hombres MujeresTotal 0 - 4 5 - 9 10 - 14 15 - 17 Total 0 - 4 5 - 9 10 - 14 15 - 17 Total 0 - 4 5 - 9 10 - 1415 - 17Amealco <strong>de</strong> Bonfil 47.0 26.2 28.5 29.9 15.5 49.8 26.7 28.7 29.9 14.7 50.2 25.7 28.3 29.8 16.2Arroyo Seco 44.1 23.3 29.1 31.4 16.3 49.6 23.4 30.7 31.0 14.9 50.4 23.2 27.5 31.7 17.6Ca<strong>de</strong>reyta <strong>de</strong> Montes 44.7 27.4 27.5 30.2 14.9 49.8 27.4 27.8 30.5 14.3 50.2 27.4 27.2 29.9 15.5Colón 44.5 27.5 27.8 29.1 15.5 50.7 28.0 28.0 28.7 15.3 49.3 27.1 27.6 29.5 15.8Corregidora 35.7 28.4 28.0 27.8 15.8 50.4 28.7 28.5 27.4 15.4 49.6 28.0 27.6 28.3 16.1El Marqués 43.2 27.3 27.5 29.4 15.9 50.7 26.9 28.0 29.3 15.8 49.3 27.7 27.0 29.4 15.9Ezequiel Montes 42.1 27.7 27.0 28.7 16.6 50.2 28.1 27.0 28.5 16.3 49.8 27.2 26.9 28.9 17.0Huimilpan 45.7 26.5 28.0 29.9 15.7 49.6 26.6 28.4 30.0 15.0 50.4 26.3 27.6 29.8 16.3Jalpan <strong>de</strong> Serra 45.6 24.4 28.6 31.1 15.9 50.4 24.7 29.7 30.8 14.8 49.6 24.1 27.6 31.4 16.9Landa <strong>de</strong> Matamoros 46.6 23.8 30.3 31.5 14.4 49.9 24.0 30.3 32.2 13.6 50.1 23.7 30.2 30.8 15.3Pedro Escobedo 41.2 26.9 27.0 29.5 16.6 50.2 27.1 27.2 29.1 16.6 49.8 26.6 26.7 29.9 16.7Peñamiller 44.3 26.9 28.6 30.3 14.3 50.0 26.3 28.5 30.6 14.6 50.0 27.5 28.6 30.0 14.0Pinal <strong>de</strong> Amoles 51.7 25.5 29.4 30.9 14.2 50.9 26.0 30.3 30.7 13.0 49.1 25.1 28.4 31.0 15.5Querétaro 34.2 26.5 27.4 29.0 17.1 50.5 26.8 27.5 29.0 16.7 49.5 26.2 27.4 29.0 17.5San Joaquín 49.1 27.1 29.0 29.1 14.8 47.7 28.5 30.7 28.8 12.0 52.3 25.9 27.5 29.3 17.3San Juan <strong>de</strong>l Río 37.8 26.8 27.6 28.9 16.7 50.7 26.9 27.7 28.9 16.5 49.3 26.7 27.5 28.9 16.9Tequisquiapan 40.4 26.1 27.4 29.7 16.7 50.7 26.2 27.4 29.5 16.9 49.3 25.9 27.5 30.0 16.6Tolimán 43.2 27.8 26.6 29.7 16.0 50.7 28.6 26.9 29.0 15.5 49.3 26.9 26.3 30.3 16.5Querétaro Arteaga 38.2 26.7 27.7 29.3 16.4 50.4 26.9 27.9 29.2 16.0 49.6 26.5 27.5 29.3 16.8Nacional 36.7 26.9 27.7 28.9 16.5 50.6 27.0 27.8 28.9 16.2 49.4 26.8 27.6 28.9 16.7Fuente: REDIM, estimaciones a partir <strong>de</strong>l II Conteo <strong>de</strong> Pob<strong>la</strong>ción y Vivienda 2005.<strong>Red</strong> <strong>por</strong> <strong>los</strong> Derechos <strong>de</strong> <strong>la</strong> Infancia en México