Migration au Mali : Profil National 2009 - IOM Publications
Migration au Mali : Profil National 2009 - IOM Publications
Migration au Mali : Profil National 2009 - IOM Publications

You also want an ePaper? Increase the reach of your titles
YUMPU automatically turns print PDFs into web optimized ePapers that Google loves.
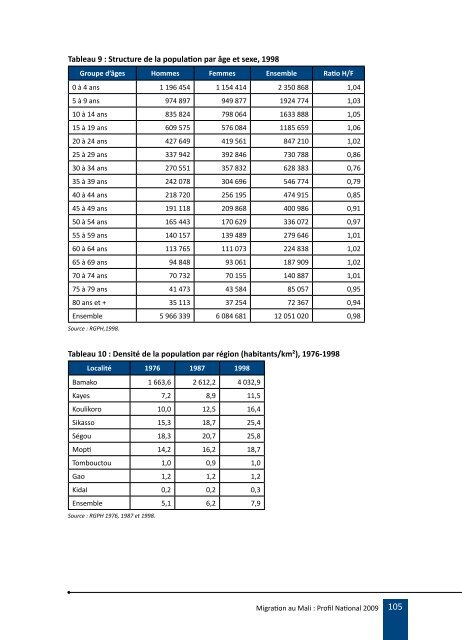
Table<strong>au</strong> 9 : Structure de la population par âge et sexe, 1998<br />
Groupe d’âges Hommes Femmes Ensemble Ratio H/F<br />
0 à 4 ans 1 196 454 1 154 414 2 350 868 1,04<br />
5 à 9 ans 974 897 949 877 1924 774 1,03<br />
10 à 14 ans 835 824 798 064 1633 888 1,05<br />
15 à 19 ans 609 575 576 084 1185 659 1,06<br />
20 à 24 ans 427 649 419 561 847 210 1,02<br />
25 à 29 ans 337 942 392 846 730 788 0,86<br />
30 à 34 ans 270 551 357 832 628 383 0,76<br />
35 à 39 ans 242 078 304 696 546 774 0,79<br />
40 à 44 ans 218 720 256 195 474 915 0,85<br />
45 à 49 ans 191 118 209 868 400 986 0,91<br />
50 à 54 ans 165 443 170 629 336 072 0,97<br />
55 à 59 ans 140 157 139 489 279 646 1,01<br />
60 à 64 ans 113 765 111 073 224 838 1,02<br />
65 à 69 ans 94 848 93 061 187 909 1,02<br />
70 à 74 ans 70 732 70 155 140 887 1,01<br />
75 à 79 ans 41 473 43 584 85 057 0,95<br />
80 ans et + 35 113 37 254 72 367 0,94<br />
Ensemble 5 966 339 6 084 681 12 051 020 0,98<br />
Source : RGPH,1998.<br />
Table<strong>au</strong> 10 : Densité de la population par région (habitants/km²), 1976-1998<br />
Localité 1976 1987 1998<br />
Bamako 1 663,6 2 612,2 4 032,9<br />
Kayes 7,2 8,9 11,5<br />
Koulikoro 10,0 12,5 16,4<br />
Sikasso 15,3 18,7 25,4<br />
Ségou 18,3 20,7 25,8<br />
Mopti 14,2 16,2 18,7<br />
Tombouctou 1,0 0,9 1,0<br />
Gao 1,2 1,2 1,2<br />
KidaI 0,2 0,2 0,3<br />
Ensemble 5,1 6,2 7,9<br />
Source : RGPH 1976, 1987 et 1998.<br />
<strong>Migration</strong> <strong>au</strong> <strong>Mali</strong> : <strong>Profil</strong> <strong>National</strong> <strong>2009</strong><br />
105