Pratique de Sas Windows ...9.3 Volume 2 - Ined
Pratique de Sas Windows ...9.3 Volume 2 - Ined
Pratique de Sas Windows ...9.3 Volume 2 - Ined

Create successful ePaper yourself
Turn your PDF publications into a flip-book with our unique Google optimized e-Paper software.
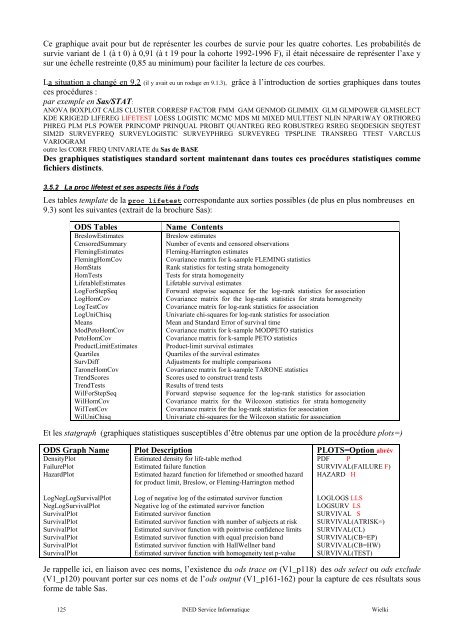
Ce graphique avait pour but <strong>de</strong> représenter les courbes <strong>de</strong> survie pour les quatre cohortes. Les probabilités <strong>de</strong><br />
survie variant <strong>de</strong> 1 (à t 0) à 0,91 (à t 19 pour la cohorte 1992-1996 F), il était nécessaire <strong>de</strong> représenter l’axe y<br />
sur une échelle restreinte (0,85 au minimum) pour faciliter la lecture <strong>de</strong> ces courbes.<br />
La situation a changé en 9.2 (il y avait eu un rodage en 9.1.3), grâce à l’introduction <strong>de</strong> sorties graphiques dans toutes<br />
ces procédures :<br />
par exemple en <strong>Sas</strong>/STAT:<br />
ANOVA BOXPLOT CALIS CLUSTER CORRESP FACTOR FMM GAM GENMOD GLIMMIX GLM GLMPOWER GLMSELECT<br />
KDE KRIGE2D LIFEREG LIFETEST LOESS LOGISTIC MCMC MDS MI MIXED MULTTEST NLIN NPAR1WAY ORTHOREG<br />
PHREG PLM PLS POWER PRINCOMP PRINQUAL PROBIT QUANTREG REG ROBUSTREG RSREG SEQDESIGN SEQTEST<br />
SIM2D SURVEYFREQ SURVEYLOGISTIC SURVEYPHREG SURVEYREG TPSPLINE TRANSREG TTEST VARCLUS<br />
VARIOGRAM<br />
outre les CORR FREQ UNIVARIATE du <strong>Sas</strong> <strong>de</strong> BASE<br />
Des graphiques statistiques standard sortent maintenant dans toutes ces procédures statistiques comme<br />
fichiers distincts.<br />
3.5.2 La proc lifetest et ses aspects liés à l’ods<br />
Les tables template <strong>de</strong> la proc lifetest correspondante aux sorties possibles (<strong>de</strong> plus en plus nombreuses en<br />
9.3) sont les suivantes (extrait <strong>de</strong> la brochure <strong>Sas</strong>):<br />
ODS Tables<br />
BreslowEstimates<br />
CensoredSummary<br />
FlemingEstimates<br />
FlemingHomCov<br />
HomStats<br />
HomTests<br />
LifetableEstimates<br />
LogForStepSeq<br />
LogHomCov<br />
LogTestCov<br />
LogUniChisq<br />
Means<br />
ModPetoHomCov<br />
PetoHomCov<br />
ProductLimitEstimates<br />
Quartiles<br />
SurvDiff<br />
TaroneHomCov<br />
TrendScores<br />
TrendTests<br />
WilForStepSeq<br />
WilHomCov<br />
WilTestCov<br />
WilUniChisq<br />
Name Contents<br />
Breslow estimates<br />
Number of events and censored observations<br />
Fleming-Harrington estimates<br />
Covariance matrix for k-sample FLEMING statistics<br />
Rank statistics for testing strata homogeneity<br />
Tests for strata homogeneity<br />
Lifetable survival estimates<br />
Forward stepwise sequence for the log-rank statistics for association<br />
Covariance matrix for the log-rank statistics for strata homogeneity<br />
Covariance matrix for log-rank statistics for association<br />
Univariate chi-squares for log-rank statistics for association<br />
Mean and Standard Error of survival time<br />
Covariance matrix for k-sample MODPETO statistics<br />
Covariance matrix for k-sample PETO statistics<br />
Product-limit survival estimates<br />
Quartiles of the survival estimates<br />
Adjustments for multiple comparisons<br />
Covariance matrix for k-sample TARONE statistics<br />
Scores used to construct trend tests<br />
Results of trend tests<br />
Forward stepwise sequence for the log-rank statistics for association<br />
Covariance matrix for the Wilcoxon statistics for strata homogeneity<br />
Covariance matrix for the log-rank statistics for association<br />
Univariate chi-squares for the Wilcoxon statistic for association<br />
Et les statgraph (graphiques statistiques susceptibles d’être obtenus par une option <strong>de</strong> la procédure plots=)<br />
ODS Graph Name<br />
DensityPlot<br />
FailurePlot<br />
HazardPlot<br />
LogNegLogSurvivalPlot<br />
NegLogSurvivalPlot<br />
SurvivalPlot<br />
SurvivalPlot<br />
SurvivalPlot<br />
SurvivalPlot<br />
SurvivalPlot<br />
SurvivalPlot<br />
Plot Description<br />
Estimated <strong>de</strong>nsity for life-table method<br />
Estimated failure function<br />
Estimated hazard function for lifemethod or smoothed hazard<br />
for product limit, Breslow, or Fleming-Harrington method<br />
Log of negative log of the estimated survivor function<br />
Negative log of the estimated survivor function<br />
Estimated survivor function<br />
Estimated survivor function with number of subjects at risk<br />
Estimated survivor function with pointwise confi<strong>de</strong>nce limits<br />
Estimated survivor function with equal precision band<br />
Estimated survivor function with HallWellner band<br />
Estimated survivor function with homogeneity test p-value<br />
PLOTS=Option abrév<br />
PDF P<br />
SURVIVAL(FAILURE F)<br />
HAZARD H<br />
LOGLOGS LLS<br />
LOGSURV LS<br />
SURVIVAL S<br />
SURVIVAL(ATRISK=)<br />
SURVIVAL(CL)<br />
SURVIVAL(CB=EP)<br />
SURVIVAL(CB=HW)<br />
SURVIVAL(TEST)<br />
Je rappelle ici, en liaison avec ces noms, l’existence du ods trace on (V1_p118) <strong>de</strong>s ods select ou ods exclu<strong>de</strong><br />
(V1_p120) pouvant porter sur ces noms et <strong>de</strong> l’ods output (V1_p161-162) pour la capture <strong>de</strong> ces résultats sous<br />
forme <strong>de</strong> table <strong>Sas</strong>.<br />
125 INED Service Informatique Wielki