Pratique de Sas Windows ...9.3 Volume 2 - Ined
Pratique de Sas Windows ...9.3 Volume 2 - Ined
Pratique de Sas Windows ...9.3 Volume 2 - Ined

Create successful ePaper yourself
Turn your PDF publications into a flip-book with our unique Google optimized e-Paper software.
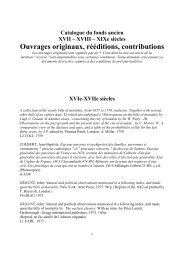
GTL Elément<br />
Title<br />
Footnote<br />
Axis Labels & Legend Title<br />
Axis Tick Values<br />
Marker Data Labels & Curve Labels<br />
Graph region hors <strong>de</strong> la zone trcé<br />
Graph region comprise entre les axes<br />
Ungrouped Scatter, Series, Step, Needles, Histograms, Bars<br />
Grouped Scatter, Series, Step, Needles, Bars<br />
Density plots<br />
Box Plots<br />
ODS Style Elément<br />
GraphTitleText<br />
GraphFootnoteText<br />
GraphLabelText<br />
GraphValueText<br />
GraphDatatext<br />
GraphBackground<br />
GraphWalls<br />
GraphDataDefault<br />
GraphData1 – GraphData12<br />
GraphFit<br />
GraphBox<br />
Ainsi en 9.3 dans le styles.<strong>de</strong>fault, nous avons repéré ces éléments <strong>de</strong> style comme nouveau par rapport à ce qui<br />
était construit en version 9.2 ou que je n’ai pu i<strong>de</strong>ntifier par ailleurs (d’où mon hypothèse en gris)<br />
class GraphFloor<br />
'plancher d’un 3D? ' /<br />
backgroundcolor = GraphColors('gfloor')<br />
color = GraphColors('gfloor');<br />
class DropShadowStyle /<br />
color = GraphColors('gshadow');<br />
class GraphSelection<br />
'lié à interactivité' /<br />
markersize = 11px<br />
markersymbol = "square"<br />
linethickness = 5px<br />
linestyle = 1<br />
contrastcolor = GraphColors('gcdata')<br />
color = GraphColors('gdata');<br />
class GraphControlLimits /<br />
markersize = 7px<br />
markersymbol = "circle"<br />
linethickness = 1px<br />
linestyle = 1<br />
contrastcolor = GraphColors('gccontrollim')<br />
color = GraphColors('gcontrollim');<br />
class GraphRunTest /<br />
markersize = 7px<br />
markersymbol = "square"<br />
linethickness = 2px<br />
linestyle = 1<br />
contrastcolor = GraphColors('gcruntest')<br />
color = GraphColors('gruntest');<br />
class GraphStars<br />
' quel nouveau graph en étoile? '/<br />
linethickness = 2px<br />
linestyle = 1<br />
contrastcolor = GraphColors('gcstars')<br />
color = GraphColors('gstars');<br />
class GraphClipping /<br />
markersize = 7px<br />
markersymbol = "circlefilled"<br />
linethickness = 2px<br />
linestyle = 2<br />
contrastcolor = GraphColors('gcclipping')<br />
color = GraphColors('gclipping');<br />
class LayoutContainer /<br />
cellpadding = 0<br />
bor<strong>de</strong>rspacing = 30<br />
bor<strong>de</strong>rwidth = 0<br />
frame = void<br />
rules = none<br />
backgroundcolor = _un<strong>de</strong>f_;<br />
End ;<br />
Run ;<br />
On suivra donc le même raisonnement que celui suivi en 1.2.2 pour détecter l’éléments à changer, sauf qu’ici<br />
nous ne pourons utiliser les ai<strong>de</strong>s déjà présentées, car elles ne s’appliquent qu’à la structure <strong>de</strong> tables.<br />
En matière d’ods graphics, les styles recommandés ou utilisés sont en fait moins nombreux comme le<br />
montre la fiche <strong>Sas</strong> sus-nommée Graph Style Tip Sheet. Le style htmlblue, par exemple, ne changera que les<br />
couleurs du style statistical. Pour se faire une idée <strong>de</strong>s variations introduites par les styles signalés en 3.1, on<br />
peut ouvrir le SGE qui permet très facilement <strong>de</strong> changer <strong>de</strong> style global, si je puis dire. Si ce que <strong>Sas</strong> a construit<br />
ne vous plait pas, alors…<br />
Ce sera une autre paire <strong>de</strong> manches que <strong>de</strong> faire une modification <strong>de</strong> style existant, mais le<br />
raisonnement, longuement vu en 1.2.3.2 sur les règles qui s’appliquent, reste valable.<br />
Ainsi on pourra co<strong>de</strong>r au lieu <strong>de</strong> soumettre ods graphics/width=400 height=350 ; :<br />
proc template;<br />
<strong>de</strong>fine style reducG;<br />
parent= styles.<strong>de</strong>fault;<br />
style Graph from Output/<br />
outputwidth = 400px<br />
outputheight = 350px;<br />
end;run;<br />
Mais on peut aussi aller changer un attribut dans le co<strong>de</strong> GTL, comme montré dans l’excellent papier <strong>de</strong><br />
l’équipe du Maryland research hospital déjà nommée en tête http://www2.sas.com/proceedings/forum2007/092-2007.pdf<br />
On découvre ainsi qu’il sera même possible d’écrire <strong>de</strong>s lignes <strong>de</strong> co<strong>de</strong> recourant directement dans le GTL à <strong>de</strong>s éléments<br />
<strong>de</strong> style prédéfinis ou <strong>de</strong>s attributs :<br />
186 <strong>Pratique</strong> <strong>de</strong> <strong>Sas</strong> windows ….93 <strong>Volume</strong> 2 et Coll.