- Page 1 and 2:
DOCUMENTS TRAVAIL193 DE PRATIQUE DE
- Page 3 and 4:
Avant Propos « Enfin ! », diront
- Page 5 and 6:
Préambule : Corrections / complém
- Page 7 and 8:
• Page 125 Define crosstabs défi
- Page 9 and 10:
Par défaut, avec ce choix indiqué
- Page 11 and 12:
• Sous ce Results Viewer, vous au
- Page 13 and 14:
Sas a aussi amélioré l’applicat
- Page 15 and 16:
Chapitre 1 ODS complément au V1: P
- Page 17 and 18:
La documentation de référence est
- Page 19 and 20:
Patient n°2 :::::::: ::::: ::::: R
- Page 21 and 22:
1.2 La modification du gabarit de s
- Page 23 and 24:
style Table from Output "Contrôle
- Page 25 and 26:
1.2.2.2 Le template de style Defaul
- Page 27 and 28:
class BodyDate / verticalalign = to
- Page 29 and 30:
1.2.2.3 Le style par défaut en 9.3
- Page 31 and 32:
:::::::::::::::::::::::::::::::::::
- Page 33 and 34:
1.2.3 Technique de transformation S
- Page 35 and 36:
Cet outil Style_Pop-up n’est pas
- Page 37 and 38:
Pour être exhaustif et en guise de
- Page 39 and 40:
proc template; define style Ks; par
- Page 41 and 42:
ods html file="d:\notes\test\habill
- Page 43 and 44:
1.2.4.4 Retouche enluminée Preimag
- Page 45 and 46:
1.3 Divers autres aspects de l’OD
- Page 47 and 48:
Grâce aux options width et keepasp
- Page 49 and 50:
1.3.2.3 Exemples • Un layout abso
- Page 51 and 52:
Sous une autre destination, cela se
- Page 53 and 54:
Chapitre 2 Les principaux changemen
- Page 55 and 56:
2.1.2 Les options système • DLCR
- Page 57 and 58:
La log/journal affiche un échec ca
- Page 59 and 60:
2.2 Les modifications de l’étape
- Page 61 and 62:
2.3 Les modifications principales d
- Page 63 and 64:
Voici un autre essai concernant une
- Page 65 and 66:
2.3.5 Proc freq • Une nouvelle op
- Page 67 and 68:
2.3.6 Proc means ods output summary
- Page 69 and 70:
Premiers gardés Les doubles au sen
- Page 71 and 72:
2.3.13 Proc univariate Du point de
- Page 73 and 74:
On peut y appliquer ces règles de
- Page 75 and 76:
2.4.2 Les nouvelles macro-fonctions
- Page 77 and 78:
2.4.4.1 MAUTOLOCINDES Cette option
- Page 79 and 80:
Par contre, après avoir créé le
- Page 81 and 82:
• Extension à la destination pdf
- Page 83 and 84:
ods output output="rdata"; ods outp
- Page 85 and 86: Chapitre 3 Quelques axes sur l’Od
- Page 87 and 88: • Il y a réglage par défaut du
- Page 89 and 90: 3.2 Les procédures SG C’est dans
- Page 91 and 92: Table 2 : Type de tracé/plot pour
- Page 93 and 94: Table2: type de tracé (suite 2) Va
- Page 95 and 96: Table5 : Les instructions de tracé
- Page 97 and 98: Toujours sur la lancée et l’idé
- Page 99 and 100: Voyons maintenant quelques exemples
- Page 101 and 102: Pour finir ce parcours d’initiati
- Page 103 and 104: Avant de passer au point suivant, j
- Page 105 and 106: 3.3 L’ODS graphic editor 3.3.1 In
- Page 107 and 108: A comparer avec l’image originale
- Page 109 and 110: 3.4 L’ODS graphic designer 3.4.1
- Page 111 and 112: Panels Différents types de classif
- Page 113 and 114: 3.4.2 Exemple 1 Un peu de représen
- Page 115 and 116: 2. Même action possible sur le Tit
- Page 117 and 118: 12. Ajouter une ligne, une colonne
- Page 119 and 120: 15. Généralisation Il est évidem
- Page 121 and 122: En conséquence de la sortie accept
- Page 123 and 124: 3.4.4 Exemple 3 Principe d’une su
- Page 125 and 126: Ce graphique avait pour but de repr
- Page 127 and 128: 3.5.3 Code et résultats Le program
- Page 129 and 130: 3.5.4 Amélioration du graphique de
- Page 131 and 132: endlayout;*fin overlay; endif; EndG
- Page 133 and 134: 3.5.5 Utilisation des variables dyn
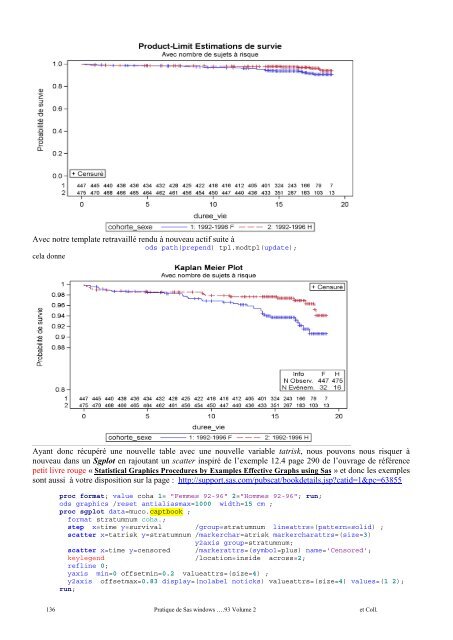
- Page 135: Un bon début mais de qualité moin
- Page 139 and 140: 2 ème étape : le retravail passer
- Page 141 and 142: Il se peut qu’au cours des clic d
- Page 143 and 144: Nous pouvons effectuer quelques hyp
- Page 145 and 146: Nom : ORPlot Libellé:Courbe du rap
- Page 147 and 148: Nom : ClassFreq Libellé:Fréquence
- Page 149 and 150: Odds ratio ou Rapport de Chances ou
- Page 151 and 152: Astuce : la capture d’un chiffre
- Page 153 and 154: 153 INED Service Informatique Wielk
- Page 155 and 156: L’utilisation en plus des 2 optio
- Page 157 and 158: Pour palier au nom peu clair des va
- Page 159 and 160: 3.6.7 La probabilité des estimates
- Page 161 and 162: 161 INED Service Informatique Wielk
- Page 163 and 164: On reprend donc notre programme là
- Page 165 and 166: Le fichier sgplotseriescat.sas capt
- Page 167 and 168: Remarques non négligeables : - Le
- Page 169 and 170: Mais malheureusement, les symboles
- Page 171 and 172: *--Aménagement de la largeur, nomm
- Page 173 and 174: Nom : ColQualMassIn Libellé:Qualit
- Page 175 and 176: C’est ce que nous allons faire av
- Page 177 and 178: 3.7.2 Proc Cluster 3.7.2.1 Sortie p
- Page 179 and 180: 3.7.2.2 Retravailler l’arbre en G
- Page 181 and 182: Il ne reste plus qu’à soumettre
- Page 183 and 184: GraphBackground Arrière-fond hors
- Page 185 and 186: NeutralColor EndColor GraphColors('
- Page 187 and 188:
seriesplot x=date y=predict / linea
- Page 189 and 190:
3.8.1.3 Quelques exemples de modifi
- Page 191 and 192:
proc template; define style boxG; p
- Page 193 and 194:
title " sgplot reg group mod"; proc
- Page 195 and 196:
• Modification de droites de rég
- Page 197 and 198:
%modstyle(name=markstyle, parent=st
- Page 199 and 200:
Les deux résultats: Rtf Pdf On con
- Page 201 and 202:
L’ancienne manière de faire avec
- Page 203 and 204:
Chapitre 4 Les échanges avec les a
- Page 205 and 206:
4.2.2 Exemples 4.2.2.1 Lecture dans
- Page 207 and 208:
• Un mot sur la variante en fonct
- Page 209 and 210:
4.2.2.3 Lecture et Ecriture en Exce
- Page 211 and 212:
4.3 ODBC Je ne suis pas spécialist
- Page 213 and 214:
Le résultat est un remplissage de
- Page 215 and 216:
4.3.3 Un exemple par rapport à Spa
- Page 217 and 218:
4.3.4 Un exemple par rapport à MyS
- Page 219 and 220:
Une fois le lieu où sont les donn
- Page 221 and 222:
-Une nouvelle « method » de class
- Page 223 and 224:
Accessible par menu déroulant à l
- Page 225 and 226:
Ensuite tous les tableaux avec ces
- Page 227 and 228:
4.5.2.2 Soumission vers Sas La soum
- Page 229 and 230:
Une autre soumission ciblée sur un
- Page 231 and 232:
4.5.2.3 Soumission vers R En 9.3 et
- Page 233 and 234:
4.5.2.4 Exemple plus approfondi Pou
- Page 235 and 236:
Si ne souhaitez pas arrondir, la co
- Page 237 and 238:
237 INED Service Informatique Wielk
- Page 239 and 240:
Ayant suffisamment montré les face
- Page 241 and 242:
4.5.3.3 Exemple plus approfondi Afi
- Page 243 and 244:
Cette fonction R s’est cependant
- Page 245 and 246:
4.5.3.4 Importations à partir de R
- Page 247 and 248:
La matrice ainsi importée est visi
- Page 249 and 250:
4.5.3.5 Conclusionsur les échanges
- Page 251 and 252:
Conclusion générale Arrivé au te
- Page 253 and 254:
Tables des Matières Avant Propos .
- Page 255 and 256:
4.3.2 Exemple élémentaire d’acc
- Page 257 and 258:
N° 167. - Angela LUCI, Olivier THE
- Page 259 and 260:
N° 109. - Éric BRIAN, Jean-Marc R
- Page 261 and 262:
N° 53. - Jacques VALLIN et France