Pratique de Sas Windows ...9.3 Volume 2 - Ined
Pratique de Sas Windows ...9.3 Volume 2 - Ined
Pratique de Sas Windows ...9.3 Volume 2 - Ined

Create successful ePaper yourself
Turn your PDF publications into a flip-book with our unique Google optimized e-Paper software.
3.5.5 Utilisation <strong>de</strong>s variables dynamiques additionnelles<br />
La documentation <strong>de</strong> la procédure nous informe <strong>de</strong> l’existence <strong>de</strong> variables dynamiques additionnelles à celles<br />
déjà existantes :<br />
dynamic NStrata xName plotAtRisk plotCensored plotCL plotHW plotEP labelCL labelHW labelEP<br />
maxTime xtickVals xtickValFitPol method StratumID classAtRisk<br />
plotBand plotTest GroupName yMin Transparency SecondTitle TestName pValue<br />
Dans la liste par défaut, toutes n’ont pas été utilisées, mais heureusement ces macro-variables ne s’enclenchent<br />
que par remplissage <strong>de</strong> valeur <strong>de</strong> par un envoi interne venant <strong>de</strong> la procédure elle-même et qui nous est invisible<br />
STRATA=<br />
OVERLAY<br />
INDIVIDUAL<br />
Dynamic<br />
StrValj<br />
NObsj<br />
NEventj<br />
Medianj<br />
LowerMedianj<br />
UpperMedianj<br />
PctMedianConfid<br />
NObs<br />
NEvent<br />
Median<br />
LowerMedian<br />
UpperMedian<br />
PctMedianConfid<br />
Description<br />
Label for the j th stratum<br />
Number of observations in the j th stratum<br />
Number of events in the j th stratum<br />
Median survival time of the j th stratum<br />
Lower median survival time of the j th stratum<br />
Upper median survival time of the j th stratum<br />
Confi<strong>de</strong>nce of the median intervals in percent<br />
Number of observations<br />
Number of events<br />
Median survival time<br />
Lower median survival time<br />
Upper median survival time<br />
Confi<strong>de</strong>nce of the median interval in percent<br />
Tentons maintenant d’ajouter quelques informations opportunes dans le graphique en prenant quelques macrovariables<br />
générales dans la liste <strong>de</strong>s variables dynamiques potentielles.<br />
L’analyse du co<strong>de</strong> précé<strong>de</strong>nt indique déjà que nous aurons à nous inspirer <strong>de</strong> la structure du layout grid<strong>de</strong>d, du<br />
discretelegend.<br />
Et la documentation <strong>de</strong> <strong>Sas</strong> juste après l’indication du tableau précé<strong>de</strong>nt page3936 renvoie au chapitre 22 <strong>de</strong><br />
l’immense brochure « <strong>Sas</strong>/Stat 9.3 user’s gui<strong>de</strong> » avec dans celle-ci, un long exemple 22.3 intitulé<br />
« Customizing Survival plots » et notre problème page 778 qui nous permet <strong>de</strong> rédiger ce co<strong>de</strong> supplémentaire<br />
tout en confirmant heureusement notre analyse <strong>de</strong> non-statisticien du co<strong>de</strong> du template.<br />
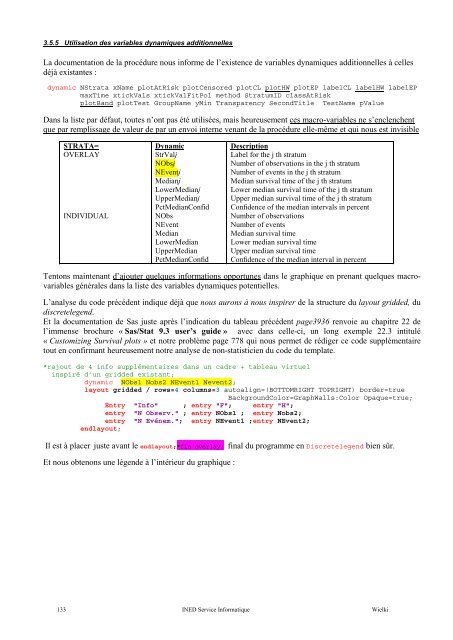
*rajout <strong>de</strong> 4 info supplémentaires dans un cadre + tableau virtuel<br />
inspiré d’un grid<strong>de</strong>d existant;<br />
dynamic NObs1 Nobs2 NEvent1 Nevent2;<br />
layout grid<strong>de</strong>d / rows=4 columns=3 autoalign=(BOTTOMRIGHT TOPRIGHT) bor<strong>de</strong>r=true<br />
BackgroundColor=GraphWalls:Color Opaque=true;<br />
Entry "Info" ; entry "F"; entry "H";<br />
entry "N Observ." ; entry NObs1 ; entry Nobs2;<br />
entry "N Evénem."; entry NEvent1 ;entry NEvent2;<br />
endlayout;<br />
Il est à placer juste avant le endlayout;*fin overlay; final du programme en Discretelegend bien sûr.<br />
Et nous obtenons une légen<strong>de</strong> à l’intérieur du graphique :<br />
133 INED Service Informatique Wielki