THÃS EE - CESBIO - Université Toulouse III - Paul Sabatier
THÃS EE - CESBIO - Université Toulouse III - Paul Sabatier
THÃS EE - CESBIO - Université Toulouse III - Paul Sabatier

You also want an ePaper? Increase the reach of your titles
YUMPU automatically turns print PDFs into web optimized ePapers that Google loves.
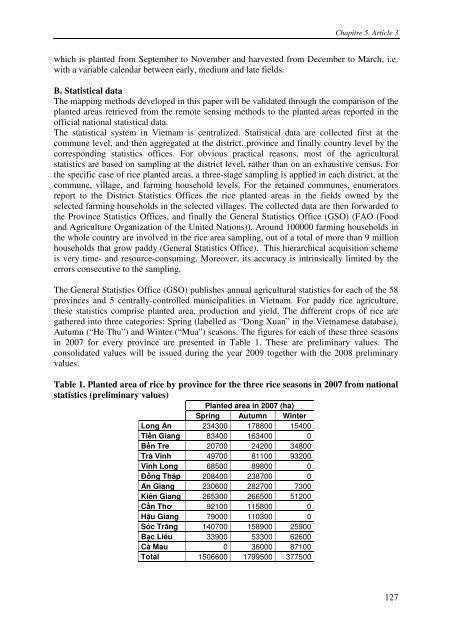
Chapitre 5. Article 3which is planted from September to November and harvested from December to March, i.e.with a variable calendar between early, medium and late fields.B. Statistical dataThe mapping methods developed in this paper will be validated through the comparison of theplanted areas retrieved from the remote sensing methods to the planted areas reported in theofficial national statistical data.The statistical system in Vietnam is centralized. Statistical data are collected first at thecommune level, and then aggregated at the district, province and finally country level by thecorresponding statistics offices. For obvious practical reasons, most of the agriculturalstatistics are based on sampling at the district level, rather than on an exhaustive census. Forthe specific case of rice planted areas, a three-stage sampling is applied in each district, at thecommune, village, and farming household levels. For the retained communes, enumeratorsreport to the District Statistics Offices the rice planted areas in the fields owned by theselected farming households in the selected villages. The collected data are then forwarded tothe Province Statistics Offices, and finally the General Statistics Office (GSO) (FAO (Foodand Agriculture Organization of the United Nations)). Around 100000 farming households inthe whole country are involved in the rice area sampling, out of a total of more than 9 millionhouseholds that grow paddy (General Statistics Office). This hierarchical acquisition schemeis very time- and resource-consuming. Moreover, its accuracy is intrinsically limited by theerrors consecutive to the sampling.The General Statistics Office (GSO) publishes annual agricultural statistics for each of the 58provinces and 5 centrally-controlled municipalities in Vietnam. For paddy rice agriculture,these statistics comprise planted area, production and yield. The different crops of rice aregathered into three categories: Spring (labelled as “Dong Xuan” in the Vietnamese database),Autumn (“He Thu”) and Winter (“Mua”) seasons. The figures for each of these three seasonsin 2007 for every province are presented in Table 1. These are preliminary values. Theconsolidated values will be issued during the year 2009 together with the 2008 preliminaryvalues.Table 1. Planted area of rice by province for the three rice seasons in 2007 from nationalstatistics (preliminary values)Planted area in 2007 (ha)Spring Autumn WinterLong An 234300 178800 15400Tiền Giang 83400 163400 0Bến Tre 20700 24200 34800Trà Vinh 49700 81100 93200Vĩnh Long 68500 89800 0Đồng Tháp 208400 238700 0An Giang 230600 282700 7300Kiên Giang 265300 266500 51200Cần Thơ 92100 115800 0Hậu Giang 79000 110300 0Sóc Trăng 140700 158900 25900Bạc Liêu 33900 53300 62600Cà Mau 0 36000 87100Total 1506600 1799500 377500127