THÃS EE - CESBIO - Université Toulouse III - Paul Sabatier
THÃS EE - CESBIO - Université Toulouse III - Paul Sabatier
THÃS EE - CESBIO - Université Toulouse III - Paul Sabatier

You also want an ePaper? Increase the reach of your titles
YUMPU automatically turns print PDFs into web optimized ePapers that Google loves.
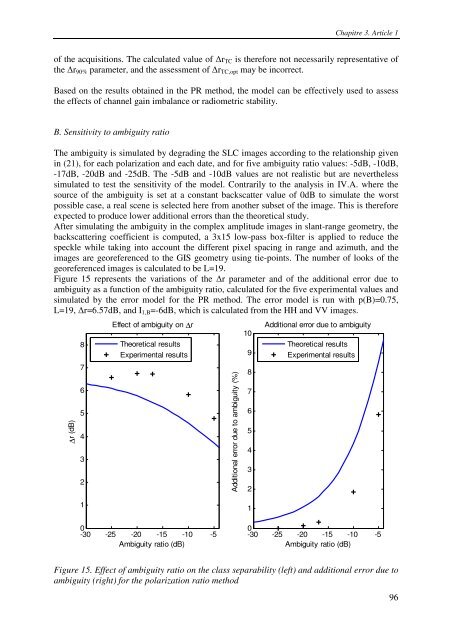
Chapitre 3. Article 1of the acquisitions. The calculated value of ∆r TC is therefore not necessarily representative ofthe ∆r 90% parameter, and the assessment of ∆r TC,opt may be incorrect.Based on the results obtained in the PR method, the model can be effectively used to assessthe effects of channel gain imbalance or radiometric stability.B. Sensitivity to ambiguity ratioThe ambiguity is simulated by degrading the SLC images according to the relationship givenin (21), for each polarization and each date, and for five ambiguity ratio values: -5dB, -10dB,-17dB, -20dB and -25dB. The -5dB and -10dB values are not realistic but are neverthelesssimulated to test the sensitivity of the model. Contrarily to the analysis in IV.A. where thesource of the ambiguity is set at a constant backscatter value of 0dB to simulate the worstpossible case, a real scene is selected here from another subset of the image. This is thereforeexpected to produce lower additional errors than the theoretical study.After simulating the ambiguity in the complex amplitude images in slant-range geometry, thebackscattering coefficient is computed, a 3x15 low-pass box-filter is applied to reduce thespeckle while taking into account the different pixel spacing in range and azimuth, and theimages are georeferenced to the GIS geometry using tie-points. The number of looks of thegeoreferenced images is calculated to be L=19.Figure 15 represents the variations of the ∆r parameter and of the additional error due toambiguity as a function of the ambiguity ratio, calculated for the five experimental values andsimulated by the error model for the PR method. The error model is run with p(B)=0.75,L=19, ∆r=6.57dB, and I 1,B =-6dB, which is calculated from the HH and VV images.∆r (dB)8765432Effect of ambiguity on ∆rTheoretical resultsExperimental resultsAdditional error due to ambiguity (%)1098765432Additional error due to ambiguityTheoretical resultsExperimental results10-30 -25 -20 -15 -10 -5Ambiguity ratio (dB)10-30 -25 -20 -15 -10 -5Ambiguity ratio (dB)Figure 15. Effect of ambiguity ratio on the class separability (left) and additional error due toambiguity (right) for the polarization ratio method96