- Page 4 and 5:
AbstractBecause of the importance o
- Page 6 and 7:
que Monique, Delphine et Maud à l
- Page 8 and 9:
Enfin, dans le cadre d’un troisi
- Page 12 and 13:
6.2. Perspectives..................
- Page 14 and 15:
Liste des tableauxTableau 1. Liste
- Page 16 and 17:
Chapitre 1. Introduction générale
- Page 18 and 19:
Chapitre 1. Introduction générale
- Page 20 and 21:
Chapitre 1. Introduction générale
- Page 22 and 23:
Chapitre 1. Introduction générale
- Page 24 and 25:
Chapitre 1. Introduction générale
- Page 26 and 27:
Chapitre 1. Introduction générale
- Page 28 and 29:
Chapitre 1. Introduction générale
- Page 30 and 31:
Chapitre 1. Introduction générale
- Page 32 and 33:
Chapitre 1. Introduction générale
- Page 34 and 35:
Chapitre 1. Introduction générale
- Page 36 and 37:
Chapitre 1. Introduction générale
- Page 38 and 39:
Chapitre 1. Introduction générale
- Page 40 and 41:
Chapitre 1. Introduction générale
- Page 42 and 43: Chapitre 2. Principes de l’imager
- Page 44 and 45: Chapitre 2. Principes de l’imager
- Page 46 and 47: Chapitre 2. Principes de l’imager
- Page 48 and 49: Chapitre 2. Principes de l’imager
- Page 50 and 51: Chapitre 2. Principes de l’imager
- Page 52 and 53: Chapitre 2. Principes de l’imager
- Page 54 and 55: Chapitre 2. Principes de l’imager
- Page 56 and 57: Chapitre 2. Principes de l’imager
- Page 58 and 59: Chapitre 2. Principes de l’imager
- Page 60 and 61: Chapitre 2. Principes de l’imager
- Page 62 and 63: Chapitre 3. Modèle d’erreur pour
- Page 64 and 65: Chapitre 3. Modèle d’erreur pour
- Page 66 and 67: Chapitre 3. Modèle d’erreur pour
- Page 68 and 69: Chapitre 3. Modèle d’erreur pour
- Page 70 and 71: Chapitre 3. Modèle d’erreur pour
- Page 72 and 73: Chapitre 3. Modèle d’erreur pour
- Page 74 and 75: Chapitre 3. Article 12011, Sentinel
- Page 76 and 77: Chapitre 3. Article 1rrB⎛ p(A)⎞
- Page 78 and 79: Chapitre 3. Article 1- p(B), the a
- Page 80 and 81: Chapitre 3. Article 1imperfections,
- Page 82 and 83: Chapitre 3. Article 11.210.80.60.40
- Page 84 and 85: Chapitre 3. Article 1and p(B)=0.5 (
- Page 86 and 87: Chapitre 3. Article 122∆ 2δShv+
- Page 88 and 89: Chapitre 3. Article 1Additional err
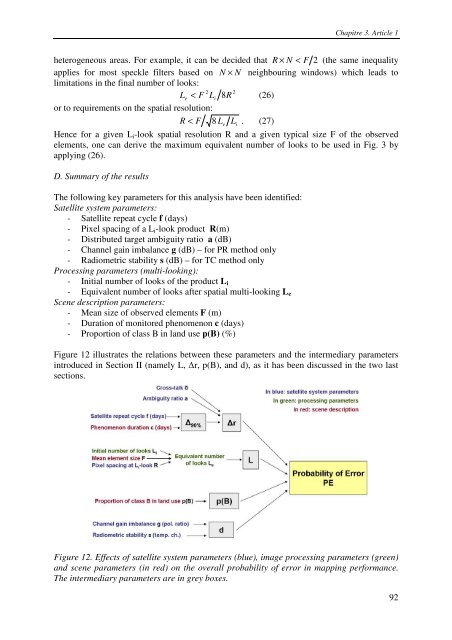
- Page 90 and 91: Chapitre 3. Article 1As suggested i
- Page 94 and 95: Chapitre 3. Article 1Table 1 summar
- Page 96 and 97: Chapitre 3. Article 1The methods ar
- Page 98 and 99: Chapitre 3. Article 1As predicted b
- Page 100 and 101: Chapitre 3. Article 1Considering th
- Page 102 and 103: Chapitre 4. Cartographie des riziè
- Page 104 and 105: Chapitre 4. Cartographie des riziè
- Page 106 and 107: Chapitre 4. Cartographie des riziè
- Page 108 and 109: Chapitre 4. Cartographie des riziè
- Page 110 and 111: Chapitre 4. Article 2109
- Page 112 and 113: Chapitre 4. Article 2111
- Page 114 and 115: Chapitre 4. Article 2113
- Page 116 and 117: Chapitre 4. Article 2115
- Page 118 and 119: Chapitre 4. Article 2117
- Page 120 and 121: Chapitre 5. Cartographie des riziè
- Page 122 and 123: Chapitre 5. Cartographie des riziè
- Page 124 and 125: Chapitre 5. Article 3USE OF ENVISAT
- Page 126 and 127: Chapitre 5. Article 3during the rep
- Page 128 and 129: Chapitre 5. Article 3which is plant
- Page 130 and 131: Chapitre 5. Article 3the whole prov
- Page 132 and 133: Chapitre 5. Article 3The 36 VGT-S10
- Page 134 and 135: Chapitre 5. Article 3tTCTCTCTCr⎛
- Page 136 and 137: Chapitre 5. Article 3Figure 7. Rice
- Page 138 and 139: Chapitre 5. Article 3Table 3. Plant
- Page 140 and 141: Chapitre 5. Article 3Table 5. Retri
- Page 142 and 143:
Chapitre 5. Article 3Tien GiangMTC
- Page 144 and 145:
Chapitre 5. Article 3Le Toan, T., R
- Page 146 and 147:
Chapitre 6. Conclusion généraleLa
- Page 148 and 149:
Chapitre 6. Conclusion généraleco
- Page 150 and 151:
Annexe A. Rapport final du projet
- Page 152 and 153:
Annexe A. Rapport final du projet
- Page 154 and 155:
Annexe A. Rapport final du projet
- Page 156 and 157:
Annexe B. Présentation du projet
- Page 158 and 159:
Annexe B. Présentation du projet
- Page 160 and 161:
Annexe C. Article 4Annexe C159
- Page 162 and 163:
Annexe C. Article 4161
- Page 164 and 165:
Annexe C. Article 4163
- Page 166 and 167:
Annexe C. Article 4165
- Page 168 and 169:
Annexe C. Article 4167
- Page 170 and 171:
Annexe C. Article 4169
- Page 172 and 173:
Annexe C. Article 4171
- Page 174 and 175:
Annexe C. Article 4173
- Page 176 and 177:
Annexe D. Article 5Annexe D175
- Page 178 and 179:
Annexe D. Article 5177
- Page 180 and 181:
Annexe D. Article 5179
- Page 182 and 183:
Annexe D. Article 5181
- Page 184 and 185:
Bibliographie[1] United Nations Dep
- Page 186 and 187:
[29] Lee J.-S., Grunes M.R., Pottie