Dispensa di modelli lineari in R - Dipartimento di Statistica
Dispensa di modelli lineari in R - Dipartimento di Statistica
Dispensa di modelli lineari in R - Dipartimento di Statistica

You also want an ePaper? Increase the reach of your titles
YUMPU automatically turns print PDFs into web optimized ePapers that Google loves.
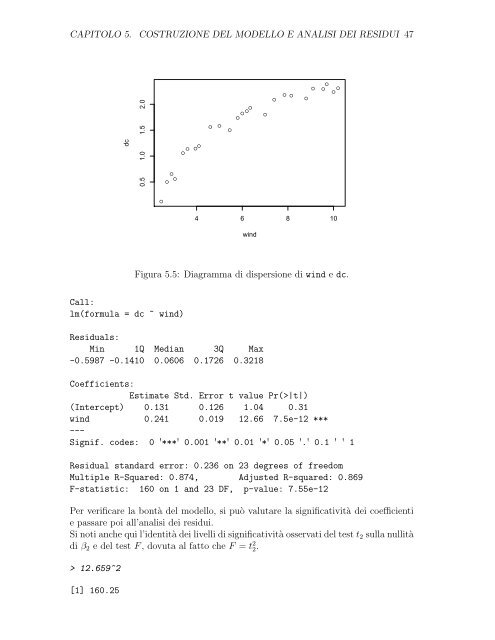
CAPITOLO 5. COSTRUZIONE DEL MODELLO E ANALISI DEI RESIDUI 47<br />
dc<br />
0.5 1.0 1.5 2.0<br />
●<br />
●<br />
●<br />
●<br />
●<br />
Call:<br />
lm(formula = dc ~ w<strong>in</strong>d)<br />
●<br />
●<br />
●<br />
●<br />
●<br />
●<br />
●<br />
●<br />
●<br />
●<br />
●<br />
●<br />
● ●<br />
●<br />
●<br />
● ● ●<br />
●<br />
4 6 8 10<br />
w<strong>in</strong>d<br />
Figura 5.5: Diagramma <strong>di</strong> <strong>di</strong>spersione <strong>di</strong> w<strong>in</strong>d e dc.<br />
Residuals:<br />
M<strong>in</strong> 1Q Me<strong>di</strong>an 3Q Max<br />
-0.5987 -0.1410 0.0606 0.1726 0.3218<br />
Coefficients:<br />
Estimate Std. Error t value Pr(>|t|)<br />
(Intercept) 0.131 0.126 1.04 0.31<br />
w<strong>in</strong>d 0.241 0.019 12.66 7.5e-12 ***<br />
---<br />
Signif. codes: 0 '***' 0.001 '**' 0.01 '*' 0.05 '.' 0.1 ' ' 1<br />
Residual standard error: 0.236 on 23 degrees of freedom<br />
Multiple R-Squared: 0.874, Adjusted R-squared: 0.869<br />
F-statistic: 160 on 1 and 23 DF, p-value: 7.55e-12<br />
Per verificare la bontà del modello, si può valutare la significatività dei coefficienti<br />
e passare poi all’analisi dei residui.<br />
Si noti anche qui l’identità dei livelli <strong>di</strong> significatività osservati del test t2 sulla nullità<br />
<strong>di</strong> β2 e del test F , dovuta al fatto che F = t 2 2.<br />
> 12.659^2<br />
[1] 160.25