Dispensa di modelli lineari in R - Dipartimento di Statistica
Dispensa di modelli lineari in R - Dipartimento di Statistica
Dispensa di modelli lineari in R - Dipartimento di Statistica

Create successful ePaper yourself
Turn your PDF publications into a flip-book with our unique Google optimized e-Paper software.
CAPITOLO 7. MODELLO DI REGRESSIONE LINEARE MULTIPLA 61<br />
●●●<br />
●<br />
●<br />
●<br />
● ●<br />
●<br />
●<br />
●<br />
● ●<br />
M<strong>in</strong> 1Q Me<strong>di</strong>an 3Q Max<br />
-1.673 -0.681 0.220 0.530 1.398<br />
temp<br />
180 185 190 195 200 205 210<br />
●●<br />
●<br />
●●<br />
●<br />
●<br />
●<br />
●<br />
16 18 20 22 24 26 28<br />
press<br />
●<br />
●<br />
●<br />
●<br />
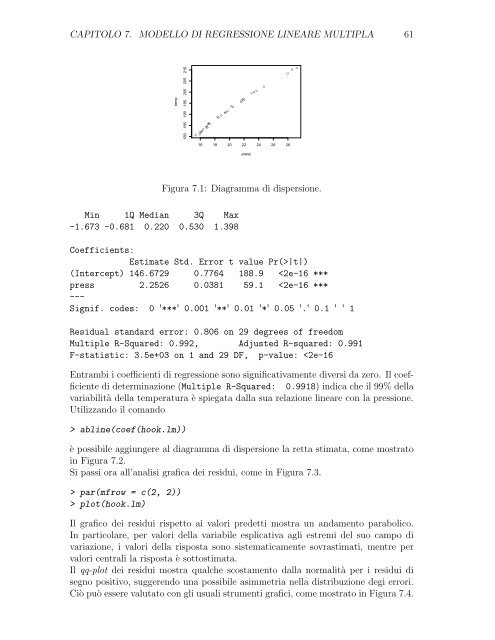
Figura 7.1: Diagramma <strong>di</strong> <strong>di</strong>spersione.<br />
Coefficients:<br />
Estimate Std. Error t value Pr(>|t|)<br />
(Intercept) 146.6729 0.7764 188.9 plot(hook.lm)<br />
Il grafico dei residui rispetto ai valori predetti mostra un andamento parabolico.<br />
In particolare, per valori della variabile esplicativa agli estremi del suo campo <strong>di</strong><br />
variazione, i valori della risposta sono sistematicamente sovrastimati, mentre per<br />
valori centrali la risposta è sottostimata.<br />
Il qq-plot dei residui mostra qualche scostamento dalla normalità per i residui <strong>di</strong><br />
segno positivo, suggerendo una possibile asimmetria nella <strong>di</strong>stribuzione degi errori.<br />
Ciò può essere valutato con gli usuali strumenti grafici, come mostrato <strong>in</strong> Figura 7.4.