
Create successful ePaper yourself
Turn your PDF publications into a flip-book with our unique Google optimized e-Paper software.
GUEST PAPER<br />
ISTAT DATA UTILIZATION TO ENHANCE<br />
LANDSAT 8 IMAGES<br />
CLASSIFICATION PROCESS<br />
by Stefano Mugnoli and Raffaella Chiocchini<br />
This paper shows an experimental study based on a LANDSAT 8 image<br />
that cover completely 5 provinces in the north of Italy, where it’s<br />
shown that ISTAT data, DEM and combine of NDVI and NDBI indices<br />
can improve the results of the satellite image classification process.<br />
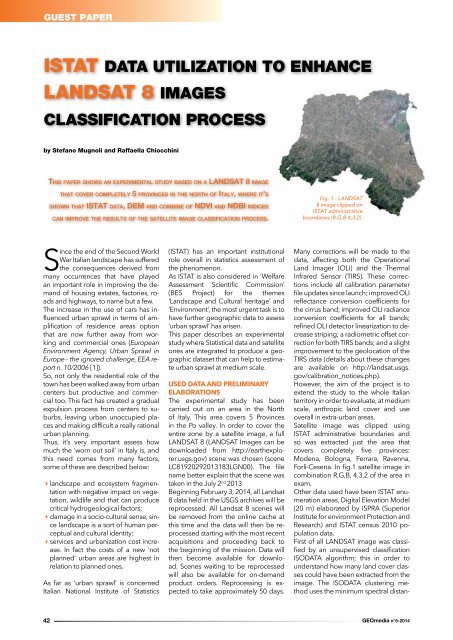
Fig. 1 - LANDSAT<br />
8 image clipped on<br />
ISTAT administrative<br />
boundaries (R,G,B 4,3,2).<br />
Since the end of the Second World<br />
War Italian landscape has suffered<br />
the consequences derived from<br />
many occurrences that have played<br />
an important role in improving the demand<br />
of housing estates, factories, roads<br />
and highways, to name but a few.<br />
The increase in the use of cars has influenced<br />
urban sprawl in terms of amplification<br />
of residence areas option<br />
that are now further away from working<br />
and commercial ones (European<br />
Environment Agency, Urban Sprawl in<br />
Europe - the ignored challenge, EEA report<br />
n. 10/2006 [1]).<br />
So, not only the residential role of the<br />
town has been walked away from urban<br />
centers but productive and commercial<br />
too. This fact has created a gradual<br />
expulsion process from centers to suburbs,<br />
leaving urban unoccupied places<br />
and making difficult a really rational<br />
urban planning.<br />
Thus, it’s very important assess how<br />
much the ‘worn out soil’ in Italy is, and<br />
this need comes from many factors,<br />
some of these are described below:<br />
4landscape and ecosystem fragmentation<br />
with negative impact on vegetation,<br />
wildlife and that can produce<br />
critical hydrogeological factors;<br />
4damage in a socio-cultural sense, since<br />
landscape is a sort of human perceptual<br />
and cultural identity;<br />
4services and urbanization cost increase.<br />
In fact the costs of a new ‘not<br />
planned’ urban areas are highest in<br />
relation to planned ones.<br />
As far as ‘urban sprawl’ is concerned<br />
Italian National Institute of Statistics<br />
(ISTAT) has an important institutional<br />
role overall in statistics assessment of<br />
the phenomenon.<br />
As ISTAT is also considered in ‘Welfare<br />
Assessment Scientific Commission’<br />
(BES Project) for the themes<br />
‘Landscape and Cultural heritage’ and<br />
‘Environment’, the most urgent task is to<br />
have further geographic data to assess<br />
‘urban sprawl’ has arisen.<br />
This paper describes an experimental<br />
study where Statistical data and satellite<br />
ones are integrated to produce a geographic<br />
dataset that can help to estimate<br />
urban sprawl at medium scale.<br />
USED DATA AND PRELIMINARY<br />
ELABORATIONS<br />
The experimental study has been<br />
carried out on an area in the North<br />
of Italy. This area covers 5 Provinces<br />
in the Po valley. In order to cover the<br />
entire zone by a satellite image, a full<br />
LANDSAT 8 (LANDSAT Images can be<br />
downloaded from http://earthexplorer.usgs.gov)<br />
scene was chosen (scene<br />
LC81920292013183LGN00). The file<br />
name better explain that the scene was<br />
taken in the July 2 nd 2013 .<br />
Beginning February 3, 2014, all Landsat<br />
8 data held in the USGS archives will be<br />
reprocessed. All Landsat 8 scenes will<br />
be removed from the online cache at<br />
this time and the data will then be reprocessed<br />
starting with the most recent<br />
acquisitions and proceeding back to<br />
the beginning of the mission. Data will<br />
then become available for download.<br />
Scenes waiting to be reprocessed<br />
will also be available for on-demand<br />
product orders. Reprocessing is expected<br />
to take approximately 50 days.<br />
Many corrections will be made to the<br />
data, affecting both the Operational<br />
Land Imager (OLI) and the Thermal<br />
Infrared Sensor (TIRS). These corrections<br />
include all calibration parameter<br />
file updates since launch; improved OLI<br />
reflectance conversion coefficients for<br />
the cirrus band; improved OLI radiance<br />
conversion coefficients for all bands;<br />
refined OLI detector linearization to decrease<br />
striping; a radiometric offset correction<br />
for both TIRS bands; and a slight<br />
improvement to the geolocation of the<br />
TIRS data (details about these changes<br />
are available on http://landsat.usgs.<br />
gov/calibration_notices.php).<br />
However, the aim of the project is to<br />
extend the study to the whole Italian<br />
territory in order to evaluate, at medium<br />
scale, anthropic land cover and use<br />
overall in extra-urban areas.<br />
Satellite image was clipped using<br />
ISTAT administrative boundaries and<br />
so was extracted just the area that<br />
covers completely five provinces:<br />
Modena, Bologna, Ferrara, Ravenna,<br />
Forlì-Cesena. In fig.1 satellite image in<br />
combination R,G,B, 4,3,2 of the area in<br />
exam.<br />
Other data used have been ISTAT enumeration<br />
areas, Digital Elevation Mo<strong>del</strong><br />
(20 m) elaborated by ISPRA (Superior<br />
Institute for environment Protection and<br />
Research) and ISTAT census 2010 population<br />
data.<br />
First of all LANDSAT image was classified<br />
by an unsupervised classification<br />
ISODATA algorithm; this in order to<br />
understand how many land cover classes<br />
could have been extracted from the<br />
image. The ISODATA clustering method<br />
uses the minimum spectral distan-<br />
42 GEOmedia n°5-2014