
You also want an ePaper? Increase the reach of your titles
YUMPU automatically turns print PDFs into web optimized ePapers that Google loves.
GUEST PAPER<br />
In brief, for each cell, the slope value<br />
is calculated as the maximum rate of<br />
change in value from that cell to its neighbors.<br />
Basically, the maximum change<br />
in elevation over the distance between<br />
the cell and its eight neighbors identifies<br />
the steepest downhill descent from<br />
the cell. The lower the slope value, the<br />
flatter the terrain; the higher the slope<br />
value, the steeper the terrain. Below a<br />
scheme that explain the concept.<br />
In order to prevent critical hydrogeological<br />
factors regional technical services<br />
propose ordinary piece of legislation to<br />
plan agricultural activities. Overall, their<br />
attention is focused on areas that have<br />
a degree of slope as high as, or higher<br />
than, 30%. In this study this value has<br />
been used to discriminate agro-forestry<br />
areas.<br />
Dem has been used to characterized<br />
flat areas and areas over 1700 m of altitude;<br />
in fact this value represent the<br />
maximum limit of woods for the area in<br />
exam. Thus using DEM and ‘slope’ layer<br />
it’ possible to classify extra-urban areas<br />
in six classes: two agricultural classes<br />
(completely plain and hilly); an ‘agroforestry’<br />
class; a broad-leaved class and<br />
finally a ‘sparsely vegetated areas’.<br />
RESULTS<br />
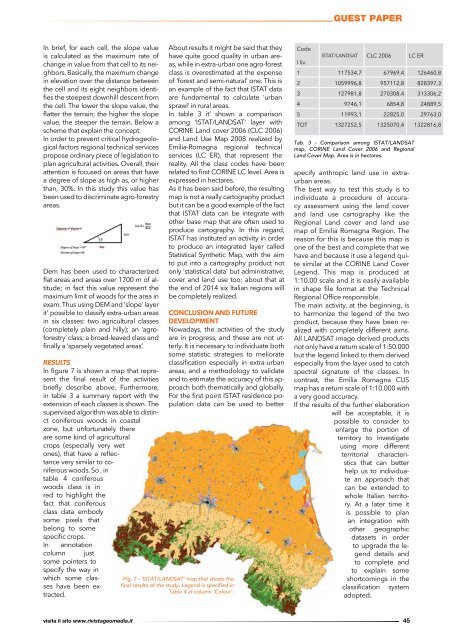
In figure 7 is shown a map that represent<br />
the final result of the activities<br />
briefly describe above. Furthermore,<br />
in table 3 a summary report with the<br />
extension of each classes is shown. The<br />
supervised algorithm was able to distinct<br />
coniferous woods in coastal<br />
zone, but unfortunately there<br />
are some kind of agricultural<br />
crops (especially very wet<br />
ones), that have a reflectance<br />
very similar to coniferous<br />
woods. So , in<br />
table 4 coniferous<br />
woods class is in<br />
red to highlight the<br />
fact that coniferous<br />
class data embody<br />
some pixels that<br />
belong to some<br />
specific crops.<br />
In annotation<br />
column just<br />
some pointers to<br />
specify the way in<br />
which some classes<br />
have been extracted.<br />
About results it might be said that they<br />
have quite good quality in urban areas,<br />
while in extra-urban one agro-forest<br />
class is overestimated at the expense<br />
of ‘forest and semi-natural’ one. This is<br />
an example of the fact that ISTAT data<br />
are fundamental to calculate ‘urban<br />
sprawl’ in rural areas.<br />
In table 3 it’ shown a comparison<br />
among ‘ISTAT/LANDSAT’ layer with<br />
CORINE Land cover 2006 (CLC 2006)<br />
and Land Use Map 2008 realized by<br />
Emilia-Romagna regional technical<br />
services (LC ER), that represent the<br />
reality. All the class codes have been<br />
related to first CORINE LC level. Area is<br />
expressed in hectares.<br />
As it has been said before, the resulting<br />
map is not a really cartography product<br />
but it can be a good example of the fact<br />
that ISTAT data can be integrate with<br />
other base map that are often used to<br />
produce cartography. In this regard,<br />
ISTAT has instituted an activity in order<br />
to produce an integrated layer called<br />
Statistical Synthetic Map, with the aim<br />
to put into a cartography product not<br />
only ‘statistical data’ but administrative,<br />
cover and land use too; about that at<br />
the end of 2014 six Italian regions will<br />
be completely realized.<br />
CONCLUSION AND FUTURE<br />
DEVELOPMENT<br />
Nowadays, the activities of the study<br />
are in progress, and these are not utterly.<br />
It is necessary to individuate both<br />
some statistic strategies to meliorate<br />
classification especially in extra-urban<br />
areas, and a methodology to validate<br />
and to estimate the accuracy of this approach<br />
both thematically and globally.<br />
For the first point ISTAT residence population<br />
data can be used to better<br />
Fig. 7 - ‘ISTAT/LANDSAT’ map that shows the<br />
final results of the study. Legend is specified in<br />
Table 4 at column ‘Colour’.<br />
Code<br />
ISTAT/LANDSAT CLC 2006 LC ER<br />
I liv.<br />
1 117534,7 67969,4 126460,8<br />
2 1059996,8 957112,8 828397,3<br />
3 127981,8 270308,4 313306,2<br />
4 9746,1 6854,8 24889,5<br />
5 11993,1 22825,0 29763,0<br />
TOT 1327252,5 1325070,4 1322816,8<br />
Tab. 3 - Comparison among ISTAT/LANDSAT<br />
map, CORINE Land Cover 2006 and Regional<br />
Land Cover Map. Area is in hectares.<br />
specify anthropic land use in extraurban<br />
areas.<br />
The best way to test this study is to<br />
individuate a procedure of accuracy<br />
assessment using the land cover<br />
and land use cartography like the<br />
Regional Land cover and land use<br />
map of Emilia Romagna Region. The<br />
reason for this is because this map is<br />
one of the best and complete that we<br />
have and because it use a legend quite<br />
similar at the CORINE Land Cover<br />
Legend. This map is produced at<br />
1:10.00 scale and it is easily available<br />
in shape file format at the Technical<br />
Regional Office responsible.<br />
The main activity, at the beginning, is<br />
to harmonize the legend of the two<br />
product, because they have been realized<br />
with completely different aims.<br />
All LANDSAT image derived products<br />
not only have a return scale of 1:50.000<br />
but the legend linked to them derived<br />
especially from the layer used to catch<br />
spectral signature of the classes. In<br />
contrast, the Emilia Romagna CUS<br />
map has a return scale of 1:10.000 with<br />
a very good accuracy.<br />
If the results of the further elaboration<br />
will be acceptable, it is<br />
possible to consider to<br />
enlarge the portion of<br />
territory to investigate<br />
using more different<br />
territorial characteristics<br />
that can better<br />
help us to individuate<br />
an approach that<br />
can be extended to<br />
whole Italian territory.<br />
At a later time it<br />
is possible to plan<br />
an integration with<br />
other geographic<br />
datasets in order<br />
to upgrade the legend<br />
details and<br />
to complete and<br />
to explain some<br />
shortcomings in the<br />
classification system<br />
adopted.<br />
visita il sito www.rivistageomedia.it<br />
45