
Create successful ePaper yourself
Turn your PDF publications into a flip-book with our unique Google optimized e-Paper software.
GUEST PAPER<br />
Classes N. pixels Interpretation<br />
Class 1 1371212 Very wet vegetated areas; broad-leaved<br />
Class 2 1169507 Coniferous<br />
Class 3 1280340 Vegetation in plan areas<br />
Class 4 803152 Rice fields; Coniferous<br />
Class 5 371962 Coniferous<br />
Class 7 302030 Water<br />
Class 10 970482 Infrastructures; services<br />
Class 11 1291884 Bare soil; not vegetated areas<br />
Class 12 1515620 Urban areas; heterogeneous rural areas<br />
Class 13 1294236 Dry bare soil<br />
Class 14 369239 Dunes; beach; clouds<br />
Tab. 1 - Unsupervised classification: summary report.<br />
ce formula to form clusters. It begins<br />
with either arbitrary cluster means or<br />
means of an existing signature set, and<br />
each time the clustering repeats, the<br />
means of these clusters are shifted. The<br />
new cluster means are used for the next<br />
iteration. The ISODATA utility repeats<br />
the clustering of the image until either a<br />
maximum number of iteration has been<br />
performed, or a maximum percentage<br />
of unchanged pixels has been reached<br />
between two iterations.<br />
After studying the clusters distance<br />
based on ‘transformed divergence’<br />
method, eight land cover classes were<br />
identified. Table 1 shows the results of<br />
unsupervised classification.<br />
The other classes are not significant.<br />
However, image classification is not the<br />
focal point of the study, because it will be<br />
corrected by integration with ISTAT and<br />
DEM data. Thus, supervised classification<br />
was realized considering just eight<br />
classes (Road networks, Coniferous,<br />
Broad-leaved, Water, Continuous urban<br />
fabric, Discontinuous urban fabric,<br />
Infrastructures and services, Bare soil).<br />
In order to rationalize further steps, it<br />
was decided to consider urban areas<br />
and extra-urban ones in two completely<br />
different ways. In fact,<br />
urban areas limits derived<br />
principally from<br />
ISTAT data, while their<br />
classification both<br />
ISTAT and satellite<br />
classification.<br />
So, first of all, the<br />
classified image was<br />
clipped using ISTAT<br />
urban areas layer.<br />
In figure 2 the classified<br />
image for<br />
Bologna municipality<br />
area.<br />
NDVI AND NDBI INDICES [2]<br />
In order to better specify land cover,<br />
overall in urban areas, some indices<br />
were calculated. So NDVI (Normalized<br />
Difference Vegetation Index) and NDBI<br />
(Normalized Difference Built-up Index)<br />
has been chosen because these can<br />
clarify green urban areas and urban fabric<br />
overall if these are utilized in combination.<br />
In fact, NDBI, that was produced<br />
using the following equation (Zha et<br />
al. 2003 [3])<br />
NDBI = MIR-NIR<br />
MIR-NIR<br />
can’t explain by itself the built-up areas<br />
(and so the urban ones) because some<br />
studies found that many vegetated areas<br />
have positive NDBI values (i.e Cibula<br />
et al., 1992 [4]; Gao, 1996 [5]).<br />
On the other hand NDVI, produced<br />
using canonical equation<br />
NDVI = NIR-RED<br />
NIR+RED<br />
can generate positive values because<br />
some kind of artificial surfaces have a<br />
major reflectance in NIR respect in RED.<br />
So what it has been said above allows<br />
to understand that these two indices<br />
combination give us better results. The<br />
two indices has been calculated using<br />
ERDAS/IMAGINE sw [6].<br />
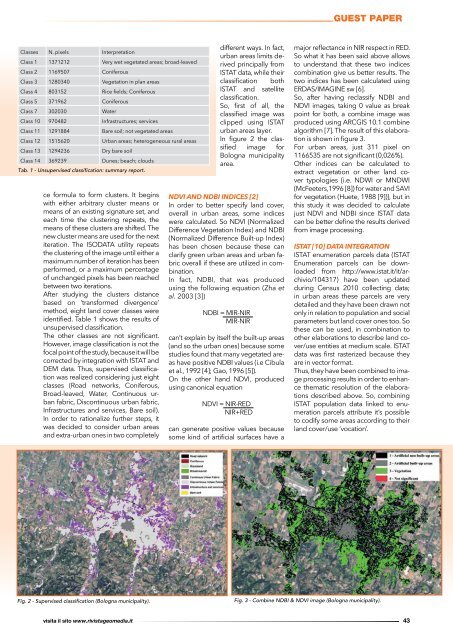
So, after having reclassify NDBI and<br />
NDVI images, taking 0 value as break<br />
point for both, a combine image was<br />
produced using ARCGIS 10.1 combine<br />
algorithm [7]. The result of this elaboration<br />
is shown in figure 3.<br />
For urban areas, just 311 pixel on<br />
1166535 are not significant (0,026%).<br />
Other indices can be calculated to<br />
extract vegetation or other land cover<br />
typologies {i.e. NDWI or MNDWI<br />
(McFeeters,1996 [8]) for water and SAVI<br />
for vegetation (Huete, 1988 [9])}, but in<br />
this study it was decided to calculate<br />
just NDVI and NDBI since ISTAT data<br />
can be better define the results derived<br />
from image processing.<br />
ISTAT [10] DATA INTEGRATION<br />
ISTAT enumeration parcels data (ISTAT<br />
Enumeration parcels can be downloaded<br />
from http://www.istat.it/it/archivio/104317)<br />
have been updated<br />
during Census 2010 collecting data;<br />
in urban areas these parcels are very<br />
detailed and they have been drawn not<br />
only in relation to population and social<br />
parameters but land cover ones too. So<br />
these can be used, in combination to<br />
other elaborations to describe land cover/use<br />
entities at medium scale. ISTAT<br />
data was first rasterized because they<br />
are in vector format.<br />
Thus, they have been combined to image<br />
processing results in order to enhance<br />
thematic resolution of the elaborations<br />
described above. So, combining<br />
ISTAT population data linked to enumeration<br />
parcels attribute it’s possible<br />
to codify some areas according to their<br />
land cover/use ‘vocation’.<br />
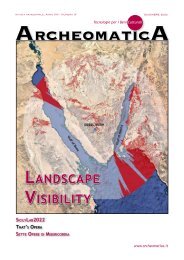
Fig. 2 - Supervised classification (Bologna municipality).<br />
Fig. 3 - Combine NDBI & NDVI image (Bologna municipality).<br />
visita il sito www.rivistageomedia.it<br />
43