Bilancio Sociale 2005 Social Report 2005
Bilancio Sociale 2005 Social Report 2005
Bilancio Sociale 2005 Social Report 2005

You also want an ePaper? Increase the reach of your titles
YUMPU automatically turns print PDFs into web optimized ePapers that Google loves.
<strong>Social</strong> <strong>Report</strong> <strong>2005</strong><br />
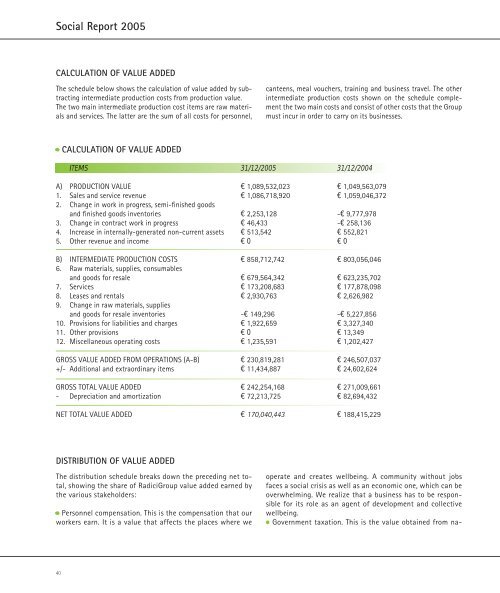
CALCULATION OF VALUE ADDED<br />
The schedule below shows the calculation of value added by subtracting<br />
intermediate production costs from production value.<br />
The two main intermediate production cost items are raw materials<br />
and services. The latter are the sum of all costs for personnel,<br />
40<br />
CALCULATION OF VALUE ADDED<br />
ITEMS 31/12/<strong>2005</strong> 31/12/2004<br />
A) PRODUCTION VALUE € 1,089,532,023 € 1,049,563,079<br />
1. Sales and service revenue € 1,086,718,920 € 1,059,046,372<br />
2. Change in work in progress, semi-fi nished goods<br />
and fi nished goods inventories € 2,253,128 -€ 9,777,978<br />
3. Change in contract work in progress € 46,433 -€ 258,136<br />
4. Increase in internally-generated non-current assets € 513,542 € 552,821<br />
5. Other revenue and income € 0 € 0<br />
B) INTERMEDIATE PRODUCTION COSTS € 858,712,742 € 803,056,046<br />
6. Raw materials, supplies, consumables<br />
and goods for resale € 679,564,342 € 623,235,702<br />
7. Services € 173,208,683 € 177,878,098<br />
8. Leases and rentals € 2,930,763 € 2,626,982<br />
9. Change in raw materials, supplies<br />
and goods for resale inventories -€ 149,296 -€ 5,227,856<br />
10. Provisions for liabilities and charges € 1,922,659 € 3,327,340<br />
11. Other provisions € 0 € 13,349<br />
12. Miscellaneous operating costs € 1,235,591 € 1,202,427<br />
GROSS VALUE ADDED FROM OPERATIONS (A-B) € 230,819,281 € 246,507,037<br />
+/- Additional and extraordinary items € 11,434,887 € 24,602,624<br />
GROSS TOTAL VALUE ADDED € 242,254,168 € 271,009,661<br />
- Depreciation and amortization € 72,213,725 € 82,694,432<br />
NET TOTAL VALUE ADDED € 170,040,443 € 188,415,229<br />
DISTRIBUTION OF VALUE ADDED<br />
The distribution schedule breaks down the preceding net total,<br />
showing the share of RadiciGroup value added earned by<br />
the various stakeholders:<br />
Personnel compensation. This is the compensation that our<br />
workers earn. It is a value that affects the places where we<br />
canteens, meal vouchers, training and business travel. The other<br />
intermediate production costs shown on the schedule complement<br />
the two main costs and consist of other costs that the Group<br />
must incur in order to carry on its businesses.<br />
operate and creates wellbeing. A community without jobs<br />
faces a social crisis as well as an economic one, which can be<br />
overwhelming. We realize that a business has to be responsible<br />
for its role as an agent of development and collective<br />
wellbeing.<br />
Government taxation. This is the value obtained from na-