Programas Municipais de Coleta Seletiva de Lixo como - Funasa
Programas Municipais de Coleta Seletiva de Lixo como - Funasa
Programas Municipais de Coleta Seletiva de Lixo como - Funasa

Create successful ePaper yourself
Turn your PDF publications into a flip-book with our unique Google optimized e-Paper software.
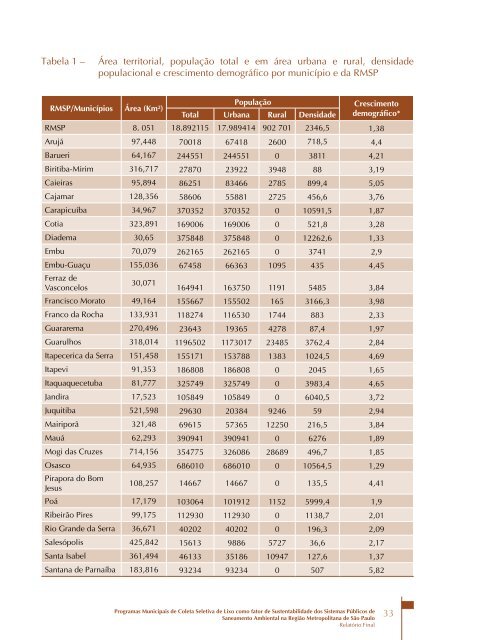
Tabela 1 – Área territorial, população total e em área urbana e rural, <strong>de</strong>nsida<strong>de</strong><br />
populacional e crescimento <strong>de</strong>mográfico por município e da RMSP<br />
RMSP/Municípios Área (Km²)<br />
População Crescimento<br />
<strong>de</strong>mográfico*<br />
Total Urbana Rural Densida<strong>de</strong><br />
RMSP 8. 051 18.892115 17.989414 902 701 2346,5 1,38<br />
Arujá 97,448 70018 67418 2600 718,5 4,4<br />
Barueri 64,167 244551 244551 0 3811 4,21<br />
Biritiba-Mirim 316,717 27870 23922 3948 88 3,19<br />
Caieiras 95,894 86251 83466 2785 899,4 5,05<br />
Cajamar 128,356 58606 55881 2725 456,6 3,76<br />
Carapicuíba 34,967 370352 370352 0 10591,5 1,87<br />
Cotia 323,891 169006 169006 0 521,8 3,28<br />
Dia<strong>de</strong>ma 30,65 375848 375848 0 12262,6 1,33<br />
Embu 70,079 262165 262165 0 3741 2,9<br />
Embu-Guaçu 155,036 67458 66363 1095 435 4,45<br />
Ferraz <strong>de</strong><br />
Vasconcelos<br />
30,071<br />
164941 163750 1191 5485 3,84<br />
Francisco Morato 49,164 155667 155502 165 3166,3 3,98<br />
Franco da Rocha 133,931 118274 116530 1744 883 2,33<br />
Guararema 270,496 23643 19365 4278 87,4 1,97<br />
Guarulhos 318,014 1196502 1173017 23485 3762,4 2,84<br />
Itapecerica da Serra 151,458 155171 153788 1383 1024,5 4,69<br />
Itapevi 91,353 186808 186808 0 2045 1,65<br />
Itaquaquecetuba 81,777 325749 325749 0 3983,4 4,65<br />
Jandira 17,523 105849 105849 0 6040,5 3,72<br />
Juquitiba 521,598 29630 20384 9246 59 2,94<br />
Mairiporã 321,48 69615 57365 12250 216,5 3,84<br />
Mauá 62,293 390941 390941 0 6276 1,89<br />
Mogi das Cruzes 714,156 354775 326086 28689 496,7 1,85<br />
Osasco 64,935 686010 686010 0 10564,5 1,29<br />
Pirapora do Bom<br />
Jesus<br />
108,257 14667 14667 0 135,5 4,41<br />
Poá 17,179 103064 101912 1152 5999,4 1,9<br />
Ribeirão Pires 99,175 112930 112930 0 1138,7 2,01<br />
Rio Gran<strong>de</strong> da Serra 36,671 40202 40202 0 196,3 2,09<br />
Salesópolis 425,842 15613 9886 5727 36,6 2,17<br />
Santa Isabel 361,494 46133 35186 10947 127,6 1,37<br />
Santana <strong>de</strong> Parnaíba 183,816 93234 93234 0 507 5,82<br />
<strong>Programas</strong> <strong>Municipais</strong> <strong>de</strong> <strong>Coleta</strong> <strong>Seletiva</strong> <strong>de</strong> <strong>Lixo</strong> <strong>como</strong> fator <strong>de</strong> Sustentabilida<strong>de</strong> dos Sistemas Públicos <strong>de</strong><br />
Saneamento Ambiental na Região Metropolitana <strong>de</strong> São Paulo<br />
Relatório Final<br />
33