
Create successful ePaper yourself
Turn your PDF publications into a flip-book with our unique Google optimized e-Paper software.
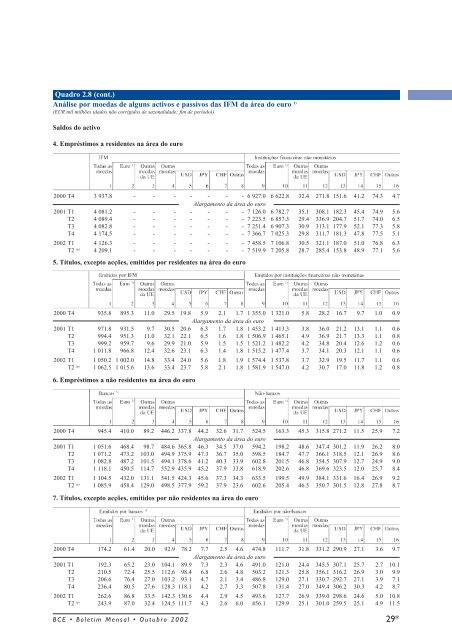
Quadro 2.8 (cont.)Análise por moedas de alguns activos e passivos das IFM da área <strong>do</strong> euro 1)(EUR mil milhões (da<strong>do</strong>s não corrigi<strong>do</strong>s de sazonalidade; fim de perío<strong>do</strong>))Sal<strong>do</strong>s <strong>do</strong> activo4. Empréstimos a residentes na área <strong>do</strong> euro2000 T4 3 937.8 - - - - - - - 6 927.0 6 622.8 32.4 271.8 151.6 41.2 74.3 4.7Alargamento da área <strong>do</strong> euro2001 T1 4 081.2 - - - - - - - 7 126.0 6 782.7 35.1 308.1 182.3 45.4 74.9 5.6T2 4 089.4 - - - - - - - 7 223.5 6 857.3 29.4 336.9 204.7 51.7 74.0 6.5T3 4 082.8 - - - - - - - 7 251.4 6 907.3 30.9 313.1 177.9 52.1 77.3 5.8T4 4 174.5 - - - - - - - 7 366.7 7 025.3 29.8 311.7 181.3 47.8 77.5 5.1<strong>2002</strong> T1 4 126.3 - - - - - - - 7 458.5 7 106.8 30.5 321.1 187.0 51.0 76.8 6.3T2 (p) 4 209.1 - - - - - - - 7 519.9 7 205.8 28.7 285.4 153.8 48.9 77.1 5.65. Títulos, excepto acções, emiti<strong>do</strong>s por residentes na área <strong>do</strong> euro2000 T4 935.8 895.3 11.0 29.5 19.8 5.9 2.1 1.7 1 355.0 1 321.0 5.8 28.2 16.7 9.7 1.0 0.9Alargamento da área <strong>do</strong> euro2001 T1 971.8 931.5 9.7 30.5 20.6 6.3 1.7 1.8 1 453.2 1 413.3 3.8 36.0 21.2 13.1 1.1 0.6T2 994.4 951.3 11.0 32.1 22.1 6.5 1.6 1.8 1 506.9 1 465.1 4.9 36.9 21.7 13.3 1.1 0.8T3 999.2 959.7 9.6 29.9 21.0 5.9 1.5 1.5 1 521.2 1 482.2 4.2 34.8 20.4 12.6 1.2 0.6T4 1 011.8 966.8 12.4 32.6 23.1 6.3 1.4 1.8 1 515.2 1 477.4 3.7 34.1 20.3 12.1 1.1 0.6<strong>2002</strong> T1 1 050.2 1 002.0 14.8 33.4 24.0 5.6 1.8 1.9 1 574.4 1 537.8 3.7 32.9 19.5 11.7 1.1 0.6T2 (p) 1 062.5 1 015.6 13.6 33.4 23.7 5.8 2.1 1.8 1 581.9 1 547.0 4.2 30.7 17.0 11.8 1.2 0.86. Empréstimos a não residentes na área <strong>do</strong> euro2000 T4 945.4 410.0 89.2 446.2 337.8 44.2 32.6 31.7 524.5 163.3 45.3 315.8 271.2 11.5 25.9 7.2Alargamento da área <strong>do</strong> euro2001 T1 1 051.6 468.4 98.7 484.6 365.8 46.3 34.5 37.0 594.2 198.2 48.6 347.4 301.2 11.9 26.2 8.0T2 1 071.2 473.2 103.0 494.9 375.9 47.3 36.7 35.0 598.5 184.7 47.7 366.1 318.5 12.1 26.9 8.6T3 1 082.8 487.2 101.5 494.1 378.6 41.2 40.3 33.9 602.8 201.5 46.8 354.5 307.9 12.7 24.9 9.0T4 1 118.1 450.5 114.7 552.9 435.9 45.2 37.9 33.8 618.9 202.6 46.8 369.6 323.5 12.0 25.7 8.4<strong>2002</strong> T1 1 104.5 432.0 131.1 541.5 424.3 45.6 37.3 34.3 633.5 199.5 49.9 384.1 331.6 16.4 26.9 9.2T2 (p) 1 085.9 458.4 129.0 498.5 377.9 59.2 37.9 23.6 602.6 205.4 46.5 350.7 301.5 12.8 27.8 8.77. Títulos, excepto acções, emiti<strong>do</strong>s por não residentes na área <strong>do</strong> euro2000 T4 174.2 61.4 20.0 92.9 78.2 7.7 2.5 4.6 474.8 111.7 31.8 331.2 290.9 27.1 3.6 9.7Alargamento da área <strong>do</strong> euro2001 T1 192.3 65.2 23.0 104.1 89.9 7.3 2.3 4.6 491.0 121.0 24.4 345.5 307.1 25.7 2.7 10.1T2 210.5 72.4 25.5 112.6 98.4 6.8 2.6 4.8 503.2 121.3 25.8 356.1 316.2 26.9 3.0 9.9T3 206.6 76.4 27.0 103.2 93.1 4.7 2.1 3.4 486.8 129.0 27.1 330.7 292.7 27.1 3.9 7.1T4 236.4 80.5 27.6 128.3 118.1 4.2 2.7 3.3 507.8 131.4 27.0 349.4 306.2 30.3 4.2 8.7<strong>2002</strong> T1 262.6 86.8 33.5 142.3 130.6 4.4 2.9 4.5 493.6 127.7 26.9 339.0 298.6 24.6 5.0 10.8T2 (p) 243.9 87.0 32.4 124.5 111.7 4.3 2.6 6.0 456.1 129.9 25.1 301.0 259.5 25.1 4.9 11.5<strong>BCE</strong> • <strong>Boletim</strong> <strong>Mensal</strong> • <strong>Outubro</strong> <strong>2002</strong> 29*