
Create successful ePaper yourself
Turn your PDF publications into a flip-book with our unique Google optimized e-Paper software.
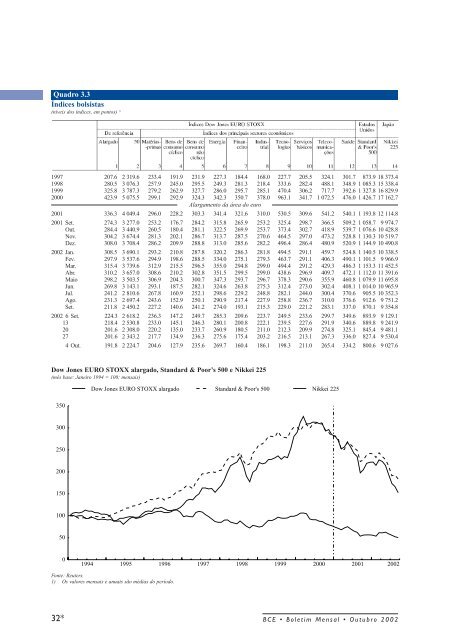
Quadro 3.3Índices bolsistas(níveis <strong>do</strong>s índices, em pontos) 1)1997 207.6 2 319.6 233.4 191.9 231.9 227.3 184.4 168.0 227.7 205.5 324.1 301.7 873.9 18 373.41998 280.5 3 076.3 257.9 245.0 295.5 249.3 281.3 218.4 333.6 282.4 488.1 348.9 1 085.3 15 338.41999 325.8 3 787.3 279.2 262.9 327.7 286.0 295.7 285.1 470.4 306.2 717.7 392.6 1 327.8 16 829.92000 423.9 5 075.5 299.1 292.9 324.3 342.3 350.7 378.0 963.1 341.7 1 072.5 476.0 1 426.7 17 162.7Alargamento da área <strong>do</strong> euro2001 336.3 4 049.4 296.0 228.2 303.3 341.4 321.6 310.0 530.5 309.6 541.2 540.1 1 193.8 12 114.82001 Set. 274.3 3 277.0 253.2 176.7 284.2 315.8 265.9 253.2 325.4 298.7 366.5 509.2 1 058.7 9 974.7Out. 284.4 3 440.9 260.5 180.4 281.1 322.5 269.9 253.7 373.4 302.7 418.9 539.7 1 076.6 10 428.8Nov. 304.2 3 674.4 281.3 202.1 286.7 313.7 287.5 270.6 464.5 297.0 473.2 528.8 1 130.3 10 519.7Dez. 308.0 3 708.4 286.2 209.9 288.8 313.0 285.6 282.2 496.4 286.4 480.9 520.9 1 144.9 10 490.8<strong>2002</strong> Jan. 308.5 3 690.1 293.2 210.8 287.8 320.2 286.3 281.8 494.5 291.1 459.7 524.8 1 140.5 10 338.5Fev. 297.9 3 537.6 294.9 198.6 288.5 334.0 275.1 279.3 463.7 291.1 406.3 490.1 1 101.5 9 966.9Mar. 315.4 3 739.6 312.9 215.5 296.5 355.0 294.8 299.0 494.4 291.2 429.3 486.3 1 153.3 11 452.5Abr. 310.2 3 657.0 308.6 210.2 302.8 351.5 299.5 299.0 438.6 296.9 409.7 472.1 1 112.0 11 391.6Maio 298.2 3 503.5 306.9 204.3 300.7 347.3 293.7 296.7 378.3 290.6 355.9 460.8 1 079.9 11 695.8Jun. 269.8 3 143.1 293.1 187.5 282.1 324.6 263.8 275.3 312.4 273.0 302.4 408.1 1 014.0 10 965.9Jul. 241.2 2 810.6 267.8 160.9 252.1 298.6 229.2 248.8 282.1 244.0 300.4 370.6 905.5 10 352.3Ago. 231.3 2 697.4 243.6 152.9 250.1 290.9 217.4 227.9 258.8 236.7 310.0 376.6 912.6 9 751.2Set. 211.8 2 450.2 227.2 140.6 241.2 274.0 193.1 215.3 229.0 221.2 283.1 337.0 870.1 9 354.8<strong>2002</strong> 6 Set. 224.3 2 618.2 236.3 147.2 249.7 285.3 209.6 223.7 249.5 233.6 299.7 349.6 893.9 9 129.113 218.4 2 530.8 233.0 145.1 246.3 280.1 200.8 222.1 239.5 227.6 291.9 340.6 889.8 9 241.920 201.6 2 308.0 220.2 135.0 233.7 260.9 180.5 211.0 212.3 209.9 274.8 325.1 845.4 9 481.127 201.6 2 343.2 217.7 134.9 236.3 275.6 175.4 203.2 216.5 213.1 267.3 336.0 827.4 9 530.44 Out. 191.8 2 224.7 204.6 127.9 235.6 269.7 160.4 186.1 198.3 211.0 265.4 334.2 800.6 9 027.6Dow Jones EURO STOXX alarga<strong>do</strong>, Standard & Poor’s 500 e Nikkei 225(mês base: Janeiro 1994 = 100; mensais)Dow Jones EURO STOXX alarga<strong>do</strong> Standard & Poor's 500 Nikkei 2253503002502001501005001994 1995 1996 1997 1998 1999 2000 2001 <strong>2002</strong>Fonte: Reuters.1) Os valores mensais e anuais são médias <strong>do</strong> perío<strong>do</strong>.32* <strong>BCE</strong> • <strong>Boletim</strong> <strong>Mensal</strong> • <strong>Outubro</strong> <strong>2002</strong>